Municipal zoning, shockingly, may be the most consequential regulatory program in the United States. This Article develops metrics for measuring the extent to which a locality’s zoning practices are exclusionary, that is, limit construction of least-cost housing. It applies the metrics to actual zoning ordinances and zoning maps, materials that legal scholars have seldom closely appraised. The municipalities chosen for study lie in three metropolitan areas, the ones listed in the Article’s title. Of the three, zoning in Greater Austin, one of the fastest growing metropolitan areas in the United States, is—to no one’s surprise—the most conducive to housing development. Austin suburbs have less large-lot zoning, more small-lot zoning, and fewer restrictions on the construction of multifamily housing. Housing prices in Silicon Valley, currently by far the highest in the United States, were only slightly above the national median in 1970. The extreme escalation of Silicon Valley housing prices has stemmed in significant part from its suburbs’ multifaceted efforts, after 1970, to limit further densification. Some towns in Greater New Haven, by contrast, adopted exclusionary policies as early as the 1930s. These towns’ enactments have distorted the region’s urban form and reduced its agglomeration efficiencies but had little effect on housing prices.
The final parts of this Article are more overtly normative. They present the case for boosting permitted residential densities in urban areas of the United States. To counter neighborhood NIMBYism, state legislatures should either preempt local discretion over what can be built or reward localities that allow denser housing.
Introduction
Joseph Eichler did as much as anyone to make life in California affordable. In the 1950s, Eichler was the preeminent builder of tract houses in what was then called the Mid-Peninsula, the region a few dozen miles south of San Francisco. During that decade, the City of Palo Alto, a suburb at the epicenter of the region, approved a dozen Eichler subdivisions in its southern section. Eichler erected houses that were Modernist in design, yet modest in both floor and lot area.1 In 1952, his company sold these houses for around $16,000 ($160,000 in 2020 dollars).2 Steve Wozniak, who co-founded Apple with Steve Jobs, would grow up in an Eichler in Sunnyvale, two suburbs south of Palo Alto.3 Despite the draw of the Bay Area’s mild Mediterranean climate, in 1970, house prices in the Palo Alto area exceeded national prices by only around twenty percent.4
As the 1970s progressed, the Mid-Peninsula region increasingly came to be known as Silicon Valley and evolved into a magnet for national and international talent in the field of information technology. This surge in demand did not, however, generate major increases in population. During the 1950s and 1960s, the population of Silicon Valley had tripled, a rate of growth faster than California’s, whose population had merely doubled. Between 1970 and 2010, by contrast, Silicon Valley grew at less than half the rate that California did and also substantially lagged behind the United States as a whole.5 The itch to live in Silicon Valley instead produced astronomic housing prices, by far the highest in the nation. In 2020, the value of an Eichler tract house in the Fairmeadow neighborhood of south Palo Alto was $2.6 million, ten times the median nationwide.6
I seek to advance understanding of these events. Municipal zoning practices, a topic of underappreciated importance, is my central focus. Many scholars and members of the media emphasize questions of national policy, issues with the greatest mass appeal. This bias neglects, however, what is arguably the most consequential regulatory program in the United States. In the early twentieth century, Los Angeles and New York City were the first U.S. cities to adopt zoning, an import pioneered in Frankfurt, Germany.7 A city’s zoning ordinance divides its territory into a number of mapped districts and varies from zone to zone regulations on the use of land. By the late 2010s, perhaps as many as fifteen thousand local governments in the United States had adopted zoning ordinances.8 Many also apply complementary tools of land use control, such as regulations that govern the subdivision of land and the preservation of buildings and neighborhoods of historic value.
It is hardly news that many localities’ zoning policies, especially in the Northeast and along the West Coast, have been exclusionary.9 As this Article amply documents, a zoning ordinance commonly imposes stiff minimum-area requirements for house lots and draconian constraints on the siting of apartment buildings. These measures can suppress housing production and jack up housing prices.10 Silicon Valley’s sky-high prices are due to not only the area’s challenging terrain and the intensity of demand to live there but also its suburbs’ restrictions on development.11
In this work, I depict the zoning policies of a total of thirty-seven suburbs and four other localities that comprise the suburban regions of three specific metropolitan areas.12 One region is Silicon Valley, home of the central offices of Apple, Facebook, Google, and countless other high-tech companies. The second, and sole Frostbelt representative, is Greater New Haven, Connecticut. The final member of the trio is metropolitan Austin, Texas, or more precisely the relatively wealthy northwestern portion of that metro.13 Each of these three metros is the home of a major research university, a feature that enhances their familiarity to scholars.
In 1880, the New Haven area was vastly more populous than the other two metros.14 That was then. Especially since 1950, Silicon Valley and Austin have emerged as superstar metros and have far eclipsed New Haven. During the 2010s, the New Haven area, for the first time in recent history, began to lose population, a sign of tepid housing demand. Austin sits at the opposite pole. Since 1970, the percentage increase in the population living near Texas’s capital city has been as great as that of any metropolitan area in the United States.15 The zoning policies of localities in these three regions have significantly influenced these varied outcomes. I demonstrate that the land use policies of Austin and its suburbs, as most would anticipate, are far more growth-conducive than those of their counterparts in Silicon Valley and Greater New Haven. And I provide metrics to quantify these differences.
Zoning controls have benefits as well as costs and unquestionably tend to be popular with homeowners in established single-family neighborhoods. In their eyes, zoning restrictions promise to raise home values, limit traffic congestion, prevent the invasion of obnoxious uses, and otherwise bring peace of mind in an uncertain and rapidly changing world.16 But the costs of exclusionary zoning commonly far exceed those benefits. People flock to urban locations to garner what urban economists unartfully call “agglomeration efficiencies,” the advantages of living near others. High-tech migrants to Silicon Valley, for example, rightly anticipate gains from residing in a more specialized labor market and having the ability to rub elbows with others like themselves.17 Exclusionary zoning practices, such as large lot requirements, tend to decrease urban densities and thus the agglomeration benefits that an urban area can offer.
Beginning around 2015, several teams of economists, employing vastly different methodologies, published much-heralded papers estimating the magnitude of exclusionary zoning’s national burden.18 Each team agrees that the costs are monumental. Herkenhoff et al. claim that U.S. labor productivity would be 12.4% higher if U.S. states were to move halfway toward Texas’s current level of land use regulation.19 Hsieh and Moretti assert that land use regulations reduced U.S. growth by 36% between 1964 and 2009.20 Albouy and Ehrlich estimate the welfare loss at 2.3%.21 Ganong and Shoag conclude that restrictive land use controls have halted the migration of low-skill households from relatively poor states to relatively wealthy states, thus misallocating the national labor force and increasing inequality.22
Although exclusionary zoning practices commonly are defended on environmental grounds, their net environmental effects tend to be negative.23 Denser living arrangements are more energy-efficient. Large-lot zoning increases automobile dependence and wastes land through sprawl.24
Joel Kotkin, one of the most enthusiastic defenders of U.S. patterns of suburban growth, attributes much of it to consumer demand for single-family detached houses. See, e.g., Densification Efforts Like SB50 Are the Wrong Fix to California’s Housing Problem, Joel Kotkin (May 13, 2019), https://joelkotkin.com/densification-efforts-like-sb50-are-the-wrong-fix-to-californias-housing-problem [https://perma.cc/Y6AH-3T7F]. Kotkin might recognize, however, more frequently than he does, that zoning regulations substantially constrain what homebuilders can supply. Each year between 1955 and 1960, about 15,000 more people migrated from Texas to California than vice versa. By 2006–2015, the net flow between the two states had reversed, to an annual flow of 25,000 in Texas’s favor.25 Policies that shift population from temperate regions of California to sweltering Texas increase the nation’s carbon footprint.26
For many commentators, however, the greatest cost of exclusionary zoning is its aggravation of class segregation. Economist Raj Chetty has found that children under the age of thirteen benefit significantly from growing up in a non-poor neighborhood.27 Exclusionary zoning, although hardly the exclusive cause of residential segregation by social class, certainly aggravates it. A nation that prizes equality of opportunity might give high priority to zoning reform.
This Article makes several contributions to the literature on zoning. Scholars have bemoaned the lack of metrics to quantify the stringency of local zoning restrictions.28 Part I proposes several metrics and applies them to the zoning governments in the three regions chosen for study. The New Haven suburbs are found, for example, to be vastly the least tolerant of subdivisions of small house lots. Readily replicable in other contexts, the proposed metrics are in many respects superior to ones currently in use. The most cited and esteemed is the Wharton Residential Land Use Regulatory Index.29 Although of unquestioned value, that index has shortcomings. The questionnaire that the Wharton team used to identify local practices generated a thirty-eight percent response rate, and the authors did not check the accuracy of the reports of the localities that did bother to reply.30
Parts II to IV present detailed profiles of the zoning policies of the localities in the three selected metros, starting with Silicon Valley and ending with Austin. These Sections, largely unprecedented in the literature on land use controls, gradually unpeel the onion of exclusionary zoning. I introduce, in due course, issues such as water supply, the structure of local government law, and racial demography. These parts also deepen understanding of the history of zoning in the United States. Not until 1965 did exclusionary practices have much effect on housing prices.31 But these practices had taken root decades earlier. Orange, Connecticut and Woodbridge, Connecticut, for example, were imposing binding large-lot requirements in the 1930s and, by the 1950s, many other New Haven suburbs had joined the bandwagon.32
The final portions of this Article are more overtly normative. Part V presents the strong, although not airtight, case that the United States would benefit from having denser urban areas. This work is part of a larger project that will include an assessment of possible zoning reforms. The Conclusion presents only summary thoughts. There, I nominate state legislatures as the key institutions to spearhead change and suggest how the wealth produced by rezonings for greater density might be used to transform local zoning politics.
In a companion Article, I emphasize a major finding of my research into zoning practices.33 Much of urban America is made up of neighborhoods of detached single-family houses. Once a neighborhood of detached houses exists, I have induced from a variety of sources that its residents almost invariably have the political power to use zoning to freeze land uses within it. At several junctures, I refer to the reality of this zoning straitjacket.
Current zoning practices impair the capacity of national labor and real estate markets to respond to changes in market conditions. Consider Professorville, a Palo Alto neighborhood of mostly single-family detached houses, perhaps forty percent individually worthy of historic preservation.34 Professorville is within easy walking distance of downtown Palo Alto and the railroad station that serves it. If unconstrained by zoning and covenants, a modern-day Joseph Eichler could plainly profit by buying up contiguous house lots in Professorville and then redeveloping the site, perhaps for townhouses or a mid-rise condominium building. But, given the political clout of Not-In-My-Backyard (NIMBY) homeowners in an established neighborhood such as Professorville, Palo Alto on its own would never allow a densification of this sort. Local politics thus elevate the preferences of Professorville homeowners and historic preservationists over the interests of, most conspicuously, potential Silicon Valley housing consumers. Writ large, diffuse municipal zoning policies are misallocating the use of urban land in the United States and distorting the spatial distribution of the nation’s labor force.
I. Measuring a Zoning Ordinance’s Exclusionary Effects
This study gauges a locality’s land-use policies from two public documents, its zoning ordinance and zoning map. The ordinance indicates the regulations applicable in each of the various zones, and the map identifies zone locations. I treat these documents as sincere expressions of local policy.
It is notable that all forty-one localities selected for study in the three metros have elected to engage in zoning.35 This is true even of the cities in Texas, where the City of Houston has famously refused to zone. Each of the forty-one also posts an online version of both its zoning map and zoning ordinance. The availability of these electronic resources, seldom exploited by legal scholars, greatly facilitates research into zoning practices.36 I selectively read the texts of all forty-one zoning ordinances, some 10,000 pages in aggregate, and measured the acreage that each locality had placed in its various residential zones. Total research time averaged over eight hours per locality.
Scholars who study land use regulation have bemoaned the lack of a consensus about how to measure the stringency of a particular set of controls. In this Part, I introduce several basic metrics for measuring a suburb’s exclusionary tilt.37 Each metric attempts to boil down a complex set of local policies to a simple number. The first three proposed metrics measure the presence (or absence) of large-lot zoning, of small-lot zoning, and of zoning to permit multifamily housing. For these, I provide results not only for each of the three metros as a whole but also for some of the forty-one localities—cities, towns, and counties—within them. A fourth metric examines the zoning of large private tracts of undeveloped land. In combination, the four do much to reveal a locality’s zoning intentions.
The metrics enable comparisons of zoning practices across space and time. A researcher could use them to generate comparable data for Greater Indianapolis or Greater Tucson. The suburbs in Greater Austin may become less friendly to developers in future decades.38 The metrics provide an objective test for determining whether this will have occurred.
The denominator for the first three metrics is the locality’s total residentially zoned area, that is, the acreage in which one of its various zones would permit some residential use as of right.39 In the three metros combined, this residentially zoned area constituted seventy-eight percent of total land area, with the remaining zones solely permitting industrial, public-facility, commercial, or other non-residential use. (Most contemporary zoning ordinances, including all forty-one studied, are “noncumulative.” A noncumulative ordinance bans residential uses in a zone set aside for other uses.)40 The most exclusionary suburbs tend to zone a higher percentage of their land for residential use. The percentage dips, sometimes even below fifty percent, in a suburb that zones large areas exclusively for industry, such as the Silicon Valley cities of Santa Clara and Sunnyvale.
The basic premise underlying this study—that a locality’s facial zoning policies are sincere—is hardly above criticism.41 A suburb obviously retains authority to amend its zoning map and zoning code (and general plan if it has one). Local zoners indeed might see advantages in adopting a wait-and-see approach.42 Officials pursuing this strategy would initially impose stringent zoning requirements and later relax them once they had received better information about the details of a proposed development. A wait-and-see strategy might better enable officials to extract benefits from developers, such as design concessions, on-site exactions, and impact fees. Moreover, zoning ordinances increasingly make land-use decisions discretionary.43 A locality may expressly retain, for example, the power to approve or reject a final site plan, subdivision map, or permit for a multifamily project. When this sort of discretion is built-in, zoning policies are harder to divine from published documents.
The mass of data assembled in this research, however, suggests that zoning is far less dynamic than generally thought.44 The thirty-seven suburbs in this study set aside 91.0% of their residentially zoned land (70.7% of their total land area) exclusively for detached single-family use.45 Once houses have actually been built on these lands, local politics virtually always prohibit a rezoning to permit denser residential use.46
My methodology nonetheless may distort political realities in some instances, both by exaggerating restrictions, and by understating them. Some suburbs, most notably Branford, Connecticut and Orange, Connecticut, have greatly tightened their zoning in a fashion that has made many existing residential uses nonconforming. Neither town has the power, nor the political inclination, to phase out these nonconformities.47 Their current zoning rules nonetheless are tallied as if sincere, which, prospectively, they generally are. Conversely, the rules on the books of some staunchly pro-growth suburbs may understate their willingness to accommodate denser residential development. Round Rock, Texas officials likely would approve a developer’s application to rezone a large undeveloped tract from the city’s basic single-family zone to a Planned Unit Development (PUD) zone that would permit greater density. The Round Rock data ignore this propensity for loosening standards. Despite these potential distortions, the proffered metrics are superior, in most applications, to those that researchers usually have employed.
A. A Primer on Lot-Sizes and Neighborhood Grain
Minimum lot-size regulations, especially in the single-family neighborhoods that blanket U.S. zoning maps, largely determine the ambiance of an urban area. In 2014, France, hardly a nation averse to regulation, flatly prohibited its municipalities from setting minimum lot-sizes for houses.48 In the United States, by contrast, these municipal zoning mandates are pervasive and largely determine the grain and population density of urban and suburban neighborhoods.49 A larger lot offers greater privacy, gardening opportunities, play-space for children, and room for house expansion. But small-lot subdivisions also have advantages. A fine-grained neighborhood typically means more playmates nearby, more visual and social variety, and a higher “walk score.”50
It is worth repeating that the thirty-seven suburbs studied restricted 91.0% of their residentially zoned land solely to the construction of single-family detached houses. Of the thirty-seven, the two most zone-happy were Redwood City, California and Guilford, Connecticut. They both had seven or more distinct single-family zones, each with a different lot-size minimum. Six of the thirty-seven suburbs, however, had only a single single-family zone. Of the six, East Palo Alto, California required the smallest lot (5,000 sq. ft.), and Orange, Connecticut the largest (one and one-half acres). An acre comprises 43,560 square feet, almost the size of a regulation-size American football field excluding the end zones. East Palo Alto’s standard 5,000-sq. ft. lot therefore is slightly less than one-eighth of an acre. Use of an unpowered lawnmower to mow a 5,000-sq. ft. lawn would be feasible, but, for a 10,000-sq. ft. lawn, laborious. To mow a one-acre lawn, a sit-down power lawnmower is virtually a necessity.
Drafters of zoning ordinances typically regard minimum lot-size requirements as the most salient of their zoning controls. Milford, Connecticut, for example, uses R-5, R-10, and R-30 as the names of three of its zones. In its case, the number that follows R- refers to the minimum thousands of square feet required for a house lot within that zone. Other types of zoning controls, such as height limits, parking requirements, and minimum front-yard setbacks, also vary and may significantly affect house designs. But, in contrast to lot-sizes, these controls are virtually never incorporated into the names of zones.
Many readers may find it hard to comprehend the meaning of an abstract number of square feet of lot area. To capture the spirit of this research, I urge you to open Google Earth, an app that provides aerial and street views of neighborhoods worldwide. Enter into the Google Earth search box the name of a locality that contains a single-family neighborhood familiar to you. Then figure out how to employ the ruler in the upper toolbar to measure the square footage of some of that neighborhood’s lots (polygons). For many readers, going through this simple exercise would greatly enhance the import of what is to come.
Several municipal zoning ordinances in northwest Greater Austin explicitly refer to 10,000 sq. ft. (0.23 acres) as a “large” lot for a detached house.51 Census Bureau data support that choice of adjective. In 2019, 64% of new single-family houses sold in the United States had a lot less than 9,000 sq. ft. in area, and 42%, a lot less than 7,000 sq. ft.52 In New England, a bastion of exclusionary zoning, however, the median house lot of a new detached dwelling is roughly twice what it is nationally.53
Cities’ required minimum lot sizes for single-family detached houses vary widely. The subdivision ordinance of pro-growth Houston, Texas requires a minimum lot of 3,500 sq. ft., even less than East Palo Alto’s 5,000 sq. ft.54 In the 1950s, Palo Alto’s minimum in its basic single-family zone was 6,000 sq. ft.55 This did not constrain Eichler, who commonly chose to provide 7,000- or 8,000-sq. ft. lots in his south Palo Alto developments.
In a neighborhood where house lots are less than 10,000 sq. ft., local officials typically compel a subdivider to install sidewalks on both sides of internal streets. In these relatively dense single-family neighborhoods, children commonly can walk to schools and shops. Especially where small lots are rectangular and deep, 5,000- to 9,000-sq. ft. neighborhoods are heaven for trick-or-treaters. After collecting a handout of goodies, they know that the next stop is but a short amble away.
In the early decades of the twentieth century, developers of several renowned upscale subdivisions, recognizing that some homebuyers prefer spacious lots, voluntarily offered lots of 10,000 sq. ft. or more. This occurred, for example, in parts of Shaker Heights, a suburb just east of Cleveland, Ohio, and the Country Club District of Kansas City, Missouri.56 When lots exceed 10,000 sq. ft. in area, sidewalks, pedestrians, and trick-or-treaters begin to disappear. When lots are 20,000 sq. ft. (one-half acre) or more, dependence on automobiles typically becomes total.
Guilford, the largest New Haven suburb in area, now requires a four-acre minimum house lot on sixty-one percent of its residentially zoned territory. A four-acre lot is twenty times larger than the lots that Eichler offered in his subdivisions in south Palo Alto.57 Fifty miles due north of Silicon Valley lies Napa County, California, site of celebrated vineyards. Napa County currently requires, in the hilly regions that comprise most of its area, a minimum lot size of 160 acres (one-quarter square mile) per house.58 The thirty-seven suburbs analyzed in this study have an average land area of 18.4 square miles. If subject to Napa County’s 160-acre minimum, the average-sized suburb would have room for seventy-four houses.
Once a locality has specified a particular minimum lot size for a single-family zone, does it ever change it? In Silicon Valley and Greater New Haven, a political ratchet seems to bar any softening of requirements. Palo Alto, California gradually raised the minimum required in its most-mapped single-family zone from 4,700 sq. ft. in 1928, to 5,000 sq. ft. in 1945, and to 6,000 sq. ft. in 1951. The exclusionary Connecticut towns of Guilford, Orange, and Woodbridge each have jacked up their minimums on three or more occasions, at least tripling their original requirements.59 In Greater Austin suburbs, however, this political ratchet does not exist. In 1978, for example, Leander, Texas established a required minimum lot of 12,500 sq. ft. in its sole single-family zone, but by 2018 had reduced it to 7,500 sq. ft.60
B. Metric One: The Incidence of Large-Lot Zoning
A simple metric for measuring exclusionary zoning is the percentage of residentially zoned land that a locality places in zones that require house lots greater than, or equal to, a particular size.61 A focal choice is a minimum lot of one-acre, a size that obviates the presence of sidewalks and trick-or-treaters. Table 1 presents, for the three metropolitan areas in the aggregate, zoning data not only for a minimum of one acre but also for various other minimum house-lot requirements.62
The New Haven area, where 74.0% of the residentially zoned land in the suburbs is restricted to single-family detached houses on lots of one acre or more, leads the three metros in large-lot zoning. Municipalities in the Austin area are, by this measure, the least prone to exclude. No surprise there. Silicon Valley’s results are middling. That region’s figures are much affected by the huge lot-size requirements that San Mateo and Santa Clara Counties impose in Silicon Valley’s foothill and mountain areas.63
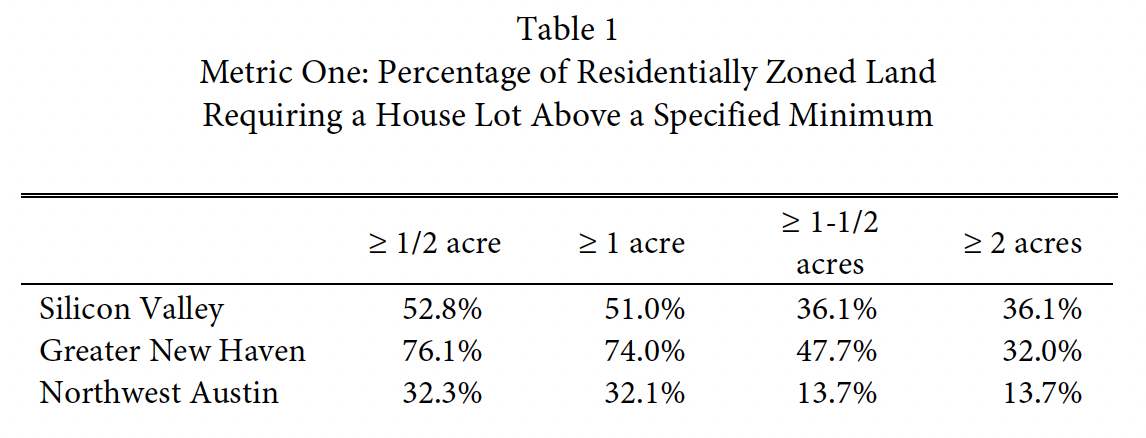
Table 2 indicates variations in the zoning practices of individual suburbs in the three metros. Each metro has at least one suburb that places over ninety-nine percent of its residentially zoned land in zones that require house lots of one acre or more and also one or more suburbs that never require a one-acre house lot. Table 2 also indicates for each metro, in brackets, the municipality with the greatest amount of acreage in zones that require house lots of at least one acre.
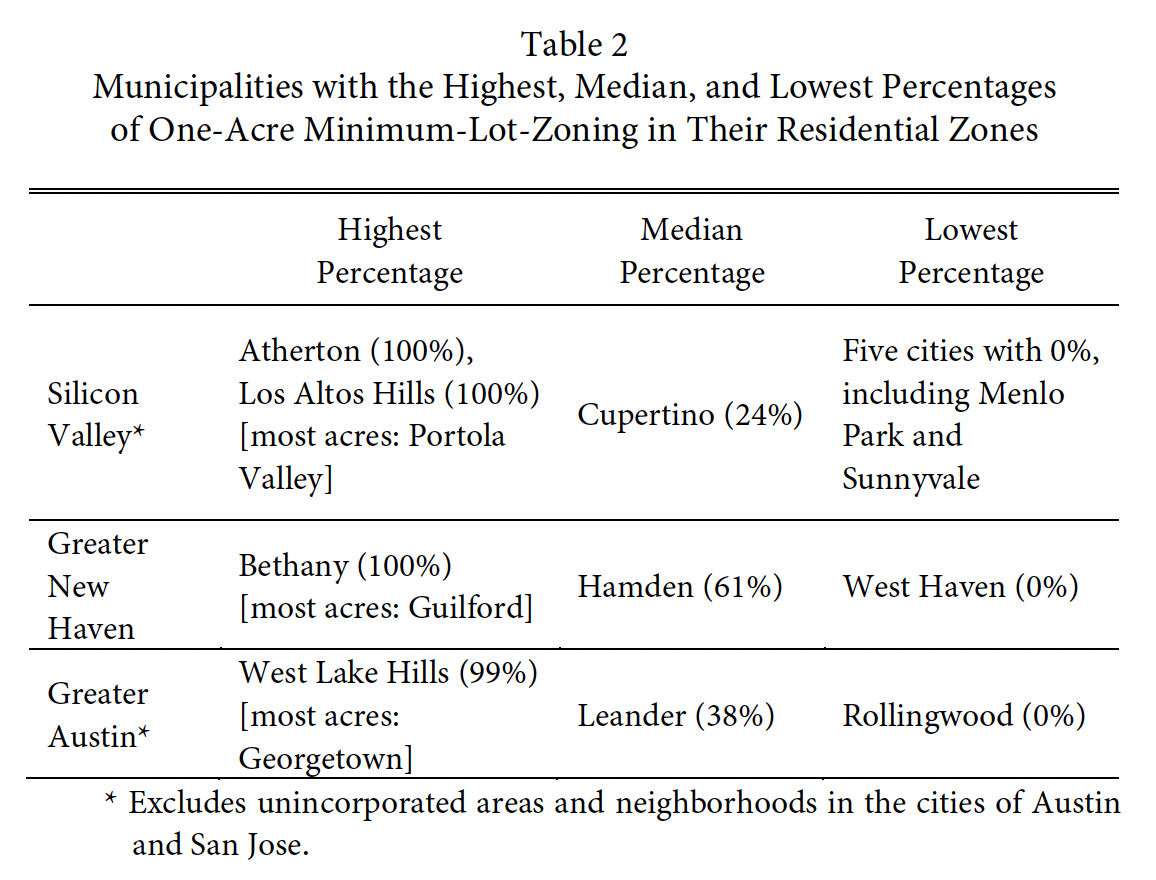
Of the thirty-seven municipalities studied, Atherton, California, currently the zip code with the highest-priced houses in the United States, first made efforts to exclude.64 In 1928, it mandated a minimum setback of forty feet, a huge distance, on either side of a house.65 Woodbridge, Connecticut, New Haven’s wealthiest suburb, employed a different regulatory technique, lotting large.66 In 1932, Woodbridge required, virtually throughout town, a house lot of 20,000 sq. ft. or more, and, in 1938, upped that requirement to 60,000 sq. ft. Large lot requirements quickly became the standard means of exclusion. In 1938, Orange, Connecticut followed Woodbridge’s lead by imposing a 20,000 sq. ft. minimum. Atherton’s leaders also eventually recognized the advantages of lotting large. In 1948, Atherton imposed, town-wide, the requirement of a one-acre minimum house lot, a signature policy that it has not altered since. West Lake Hills, Texas, long the king of one-acre zoning in the Austin suburbs studied, was not incorporated until 1953.
C. Metric Two: Allowing Detached Houses on Small Lots
Exclusionary zoning is popularly taken to be synonymous with requirements for multi-acre single-family house lots. This is not correct. Another finding of this study is the sharpness of the variations in suburbs’ willingness to allow single-family detached houses on lots ranging from 5,000 to 8,000 sq. ft., that is, Eichler-grained subdivisions. A suburb requiring 20,000-sq. ft. lots in all its single-family neighborhoods might be able to exclude homebuyers of modest income as successfully as a suburb requiring five-acre lots.67
Metric Two identifies a locality’s tolerance of relatively small lots for detached houses. The denominator, as usual, is the total acreage in zones that allow some residential use as of right. The numerator is the zoned acreage that would permit house lots as small as the stated size. Table 3 presents gross findings for the three metros for three relatively modest minimums: 6,000, 8,000, and 10,000 sq. ft.
Table 3 identifies a stunning outlier. New Haven suburbs, honoring a distaste widely shared in New England and nearby states, are vastly the harshest on would-be developers of subdivisions of modestly sized house lots.68 Only one New Haven suburb, Milford, allows more than 2% of its residentially zoned territory to be developed into Eichler-sized 8,000-sq. ft. lots. The equivalent figure for Cedar Park, Texas, Round Rock, Texas, and East Palo Alto, California is over 80% and for Santa Clara, CA and Sunnyvale, California, around 65%.
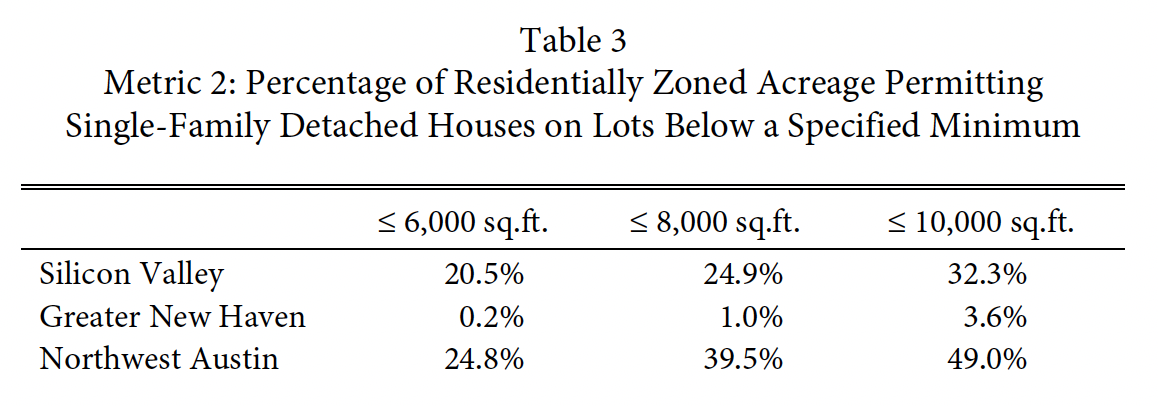
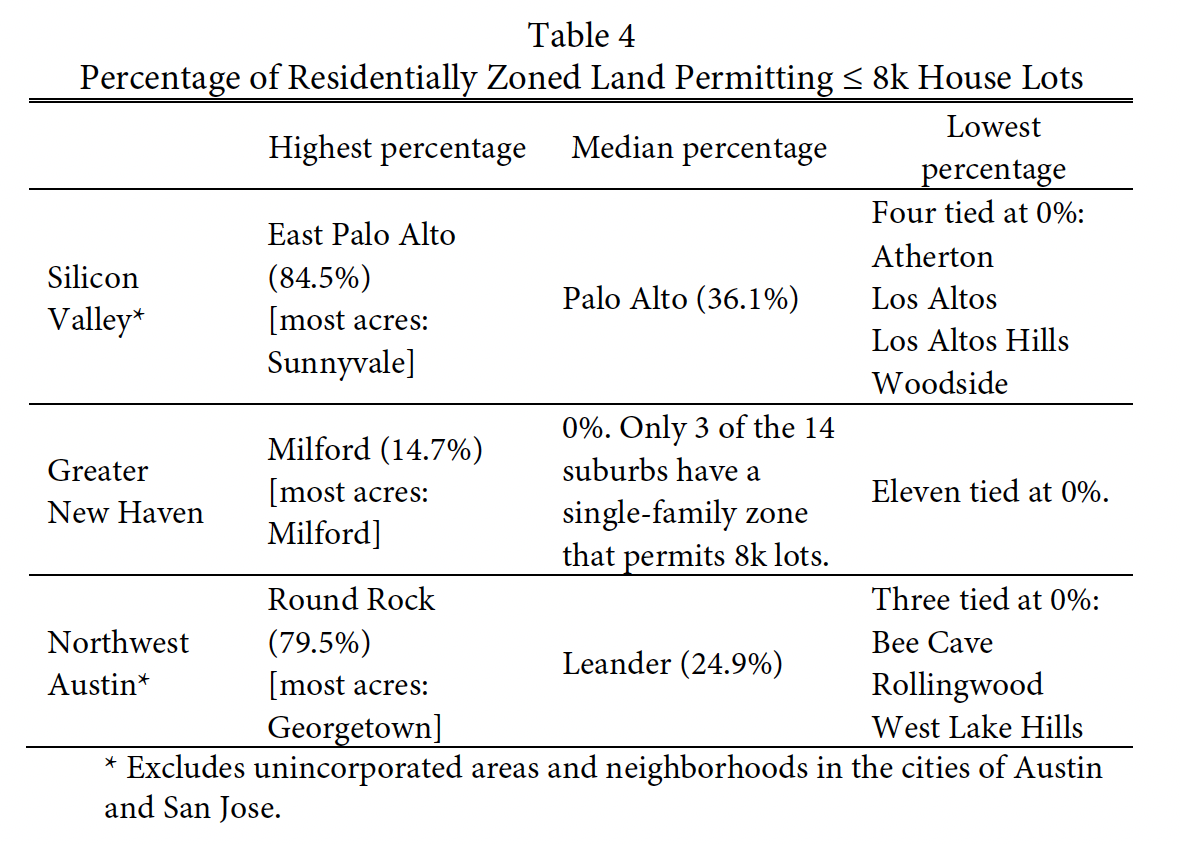
Table 4 helps unpack the gross data presented in Table 3. It reports only on suburbs’ tolerances of houses on an 8,000-sq. ft. lot.
D. Metric Three: Permitting Multifamily Housing as of Right
Denser residential developments tend to be more affordable. Metric Three tallies, for the various localities, the percentage of residentially zoned land on which a developer, as of right, could build multifamily housing at a density of at least eight gross dwelling units per acre.69 Examples of these potentially lower-cost structures are apartment buildings, townhouses with party walls, and parks for mobile homes (“manufactured housing” is the contemporary euphemism). Multifamily housing, as I use the term, refers to any of these denser forms of development, provided that the zoning ordinance permits at least eight gross units per acre.70 In all three metros, localities’ zoning ordinances commonly state that a would-be developer of a multifamily project has to apply for and receive a discretionary permit. This study assumes, however, that, if a locality had gone so far as to name its zone “multifamily,” “apartments,” “townhouse,” “mobile home,” or the like, it would grant the permit.
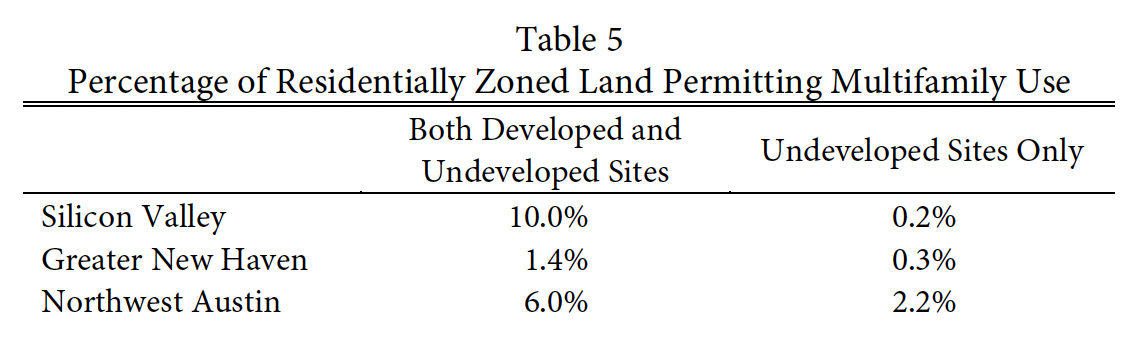
Table 5 indicates the percentage of residentially zoned land where local authorities in the three metros permit multifamily use, so defined. Google Earth enables an estimate of the extent of existing development. Fifty percent coverage with buildings, asphalt, or intensive landscaping was used as the breakpoint for characterizing a site as “developed.” Table 5 reports separate findings for developed and undeveloped multifamily sites.
As Table 5 implies, existing residential development in the Silicon Valley generally is denser than in the other two metros. The table reveals that New Haven suburbs are especially hostile to multifamily housing. Perhaps the most notable finding is that undeveloped multifamily land is roughly ten times more commonly available in the northwest Austin sector than in the other two metros.
To provide more texture, Table 6 indicates variations in municipal policies governing the building of multifamily housing.
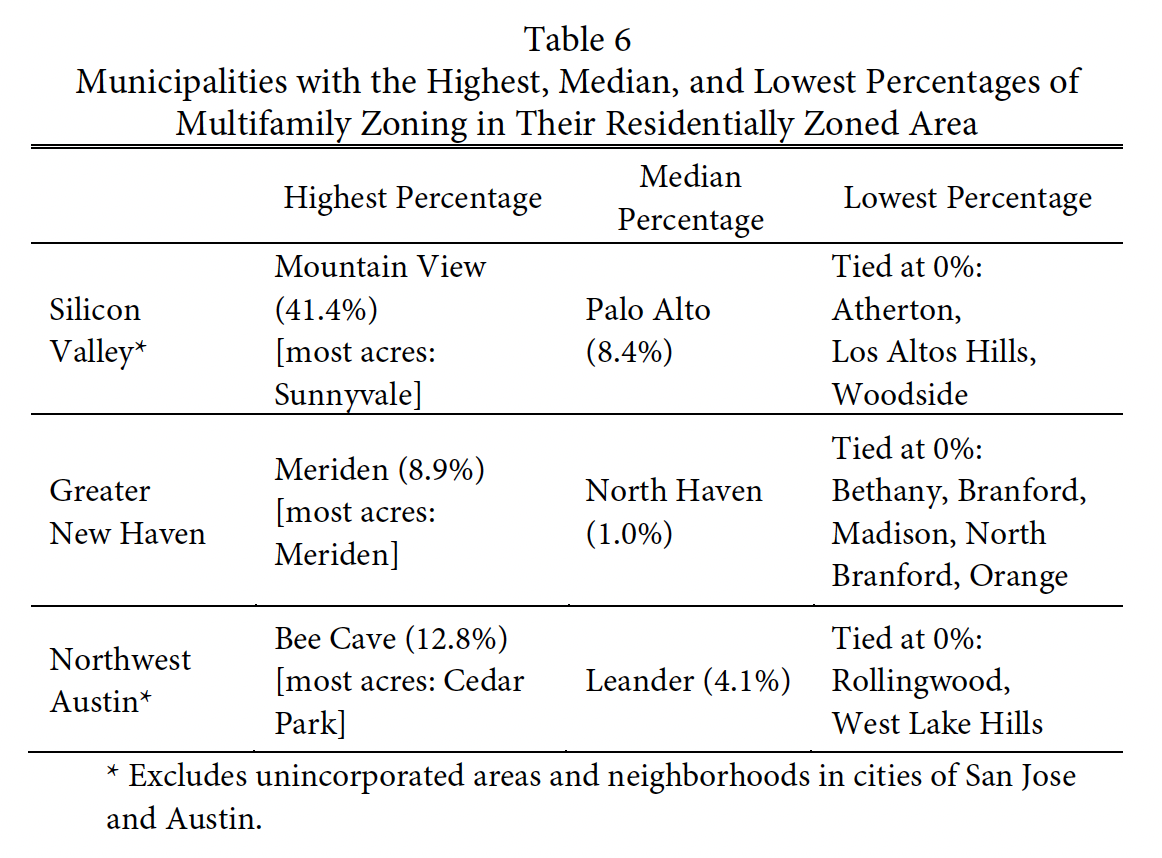
In the three metros, the municipalities with the highest percentages of undeveloped residential land currently zoned for multifamily use were East Palo Alto, California (2.8%); Meriden, Connecticut (2.7%); and Bee Cave, Texas (7.3%). A multifamily housing developer looking for a permissibly zoned and undeveloped site would find fewer acres of it in the entire Silicon Valley than in any one of four different suburbs northwest of Austin: Cedar Park, Georgetown, Leander, and Round Rock.
E. How Do Suburbs Zone Large Undeveloped Tracts of Land?
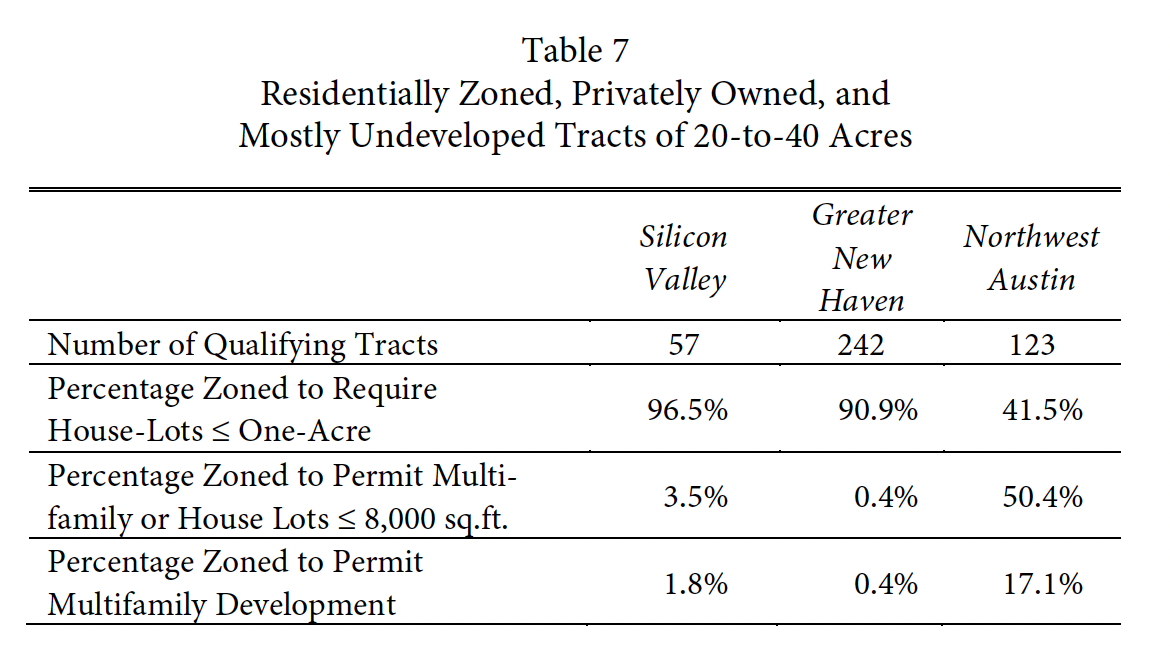
In a developed neighborhood of detached houses, zoning is virtually frozen.71 A suburb has more political freedom in zoning a largish tract of mostly undeveloped land. Table 7 reveals how localities in the three metros zone a tract of land that satisfies all of the following four criteria: (1) it is mostly undeveloped; (2) it is zoned to permit residential use as of right; (3) it has an area of between twenty and forty acres; and (4) it is owned privately, but not by a non-profit, such as a country club. A tract meeting these four criteria of course might not have been developed for good reason. From a supply-side perspective, it might disproportionately contain steep hillsides, ledges, and wetlands.72 On the demand side, it might be remote from utility services and employment opportunities.
Tracts that satisfy all four criteria are present in only four of the fifteen suburbs in Silicon Valley. In that metro, eighty-one percent of these largish, privately owned, and undeveloped tracts are situated high in the upper-foothill and mountain areas of Portola Valley, Woodside, and unincorporated Santa Clara County. None of those localities permit, in these locations, a house lot of less than five acres.
The fourteen suburbs in the long-settled New Haven area have more undeveloped private land. On average, they have seventeen of these privately owned, residentially zoned, and undeveloped tracts. Each town has at least two. The New Haven suburbs require a house lot of at least one acre on 90.9% of these twenty-to-forty-acre undeveloped tracts (see Table 7).73 They mandate a house lot of at least 15,000 sq. ft. on 98.3% and permit a lot of 8,000 sq. ft. or less on only 0.4% of these largish tracts. New Haven suburbs, by requiring large lots and suppressing small lots, thus fire both barrels of the exclusionary shotgun.
The data in Table 7 perhaps best demonstrate the relatively pro-growth policies of municipalities in Austin’s northwest sector. Of their privately owned, undeveloped parcels of twenty-to-forty acres, they zone 33.3% to permit subdivisions of house lots no larger than 8,000 sq. ft., and an additional 17.1% to permit multifamily construction. This combined percentage of 50.4% is roughly ten times greater than the combined percentage for Silicon Valley, and 100 times greater than that for Greater New Haven. Even Georgetown, Texas, the oldest and least pro-development of the four suburbs in Williamson County north of Austin, authorizes the subdivision of 35% of its forty-eight largish, undeveloped private tracts into house lots as small as 5,500 sq. ft.
Of the 299 qualifying tracts in Silicon Valley and Greater New Haven, three are zoned to permit the construction of multifamily housing, two in North San Jose, California and one in Hamden, Connecticut. Austin localities, by contrast, are particularly prone to authorize multifamily development on largish undeveloped private tracts. They authorize multifamily use on 17% of them, a percentage almost triple of what they allow on their residentially zoned land in general.74 The Williamson County, Texas suburbs of Cedar Park, Leander, and Round Rock each contain four or more of these densely developable largish private tracts.
II. Silicon Valley: Slamming the Door on Growth
But enough, for a time, of tables. The next three Parts provide verbal descriptions of the geography, governance, and zoning history of the three metros, considered in their usual order.
These zoning histories are distinct. Some New Haven suburbs were committed to exclusion as early as the 1930s, and a majority were by the end of the 1950s. Most suburbs northwest of Austin, by contrast, continue to apply policies that affirmatively favor housing development. The history of zoning in Silicon Valley has been more volatile. During the immediate Post-War period, many Silicon Valley suburbs were pro-development. Between roughly 1965 and 1975, however, most of them withdrew their welcome mats.
This shift had two main causes. The first was the advent of the environmental movement, a cause particularly fervent in the Bay Area. Stanford graduates Denis Hayes and Pete McCloskey, the latter a local congressman, were key organizers of Earth Day 1970, an event that helped trigger a nationwide surge of environmentalism.75 Responding to this shift in voters’ priorities, California legislators enacted several measures that strengthened the legal toolkits of antidevelopment forces. The most important of these was the California Environmental Quality Act of 1970 (CEQA) and the requirement that the zoning ordinance of a general law city conform to its comprehensive plan.76
Between 1965 and 1975, politics in Silicon Valley cities also turned increasingly antidevelopment.77 The ensuing discussion features the rise of the Residentialists in Palo Alto, one of Silicon Valley’s relatively upscale suburbs. But politicians in nearby cities such as Mountain View and Redwood City, long havens of the less wealthy, also cooled on supporting housing development.78 Members of the California state judiciary similarly shifted course during 1965–1975. Prior to 1967, California judges had tended to defer to a locality’s zoning choices, whether pro- or anti-development. After 1967, however, the California Supreme Court began to side with the antidevelopment party “as if nothing else in a case mattered.”79 These legal changes, coupled with the increasingly pinched supply of buildable land in Silicon Valley, stifled new housing supply.80 When demand by well-paid tech workers to live in Silicon Valley surged, house prices soared.
The second cause of the shift toward antidevelopment policies, ironically, was what Eichler and other entrepreneurs had accomplished during the 1950s and 1960s. By 1970, these homebuilders had transformed much of Silicon Valley’s most buildable land from agricultural fields into neighborhoods of single-family houses. The owners of these houses passionately opposed denser development in or near where they resided. Their NIMBYism has helped rocket Silicon Valley housing prices upward and has increasingly forced legislators in Sacramento to confront issues of housing affordability.81
In 2017, State Senator Scott Wiener took up the cause of reducing local barriers to housing production, at times with success. Appraisals of the complex and fast-changing legal situation in California include Christopher S. Elmendorf, Eric Biber, Paavo Monkkonen & Moira O’Neill, Making It Work: Legal Foundations for Administrative Reform of California’s Housing Framework, 47 Ecology L.Q. 973 (2020), and Moira O’Neill, Giulia Gualco-Nelson & Eric Biber, Developing Policy from the Ground Up: Examining Entitlement in the Bay Area to Inform California’s Housing Policy Debates, 25 Hastings Env’t L. Rev. 1 (2019).
A. Introduction to Silicon Valley
Silicon Valley inaptly describes the region that now bears that name. The territory chosen for study, the lightest-colored portion of Figure 1, would be more accurately called Silicon Slope. It forms an incline that ascends westerly, over the course of eight to twelve miles, from the San Francisco Bay to the 2,000-foot-high ridge of the Santa Cruz Mountains.82 Along the ridge’s crest runs Skyline Drive, the western
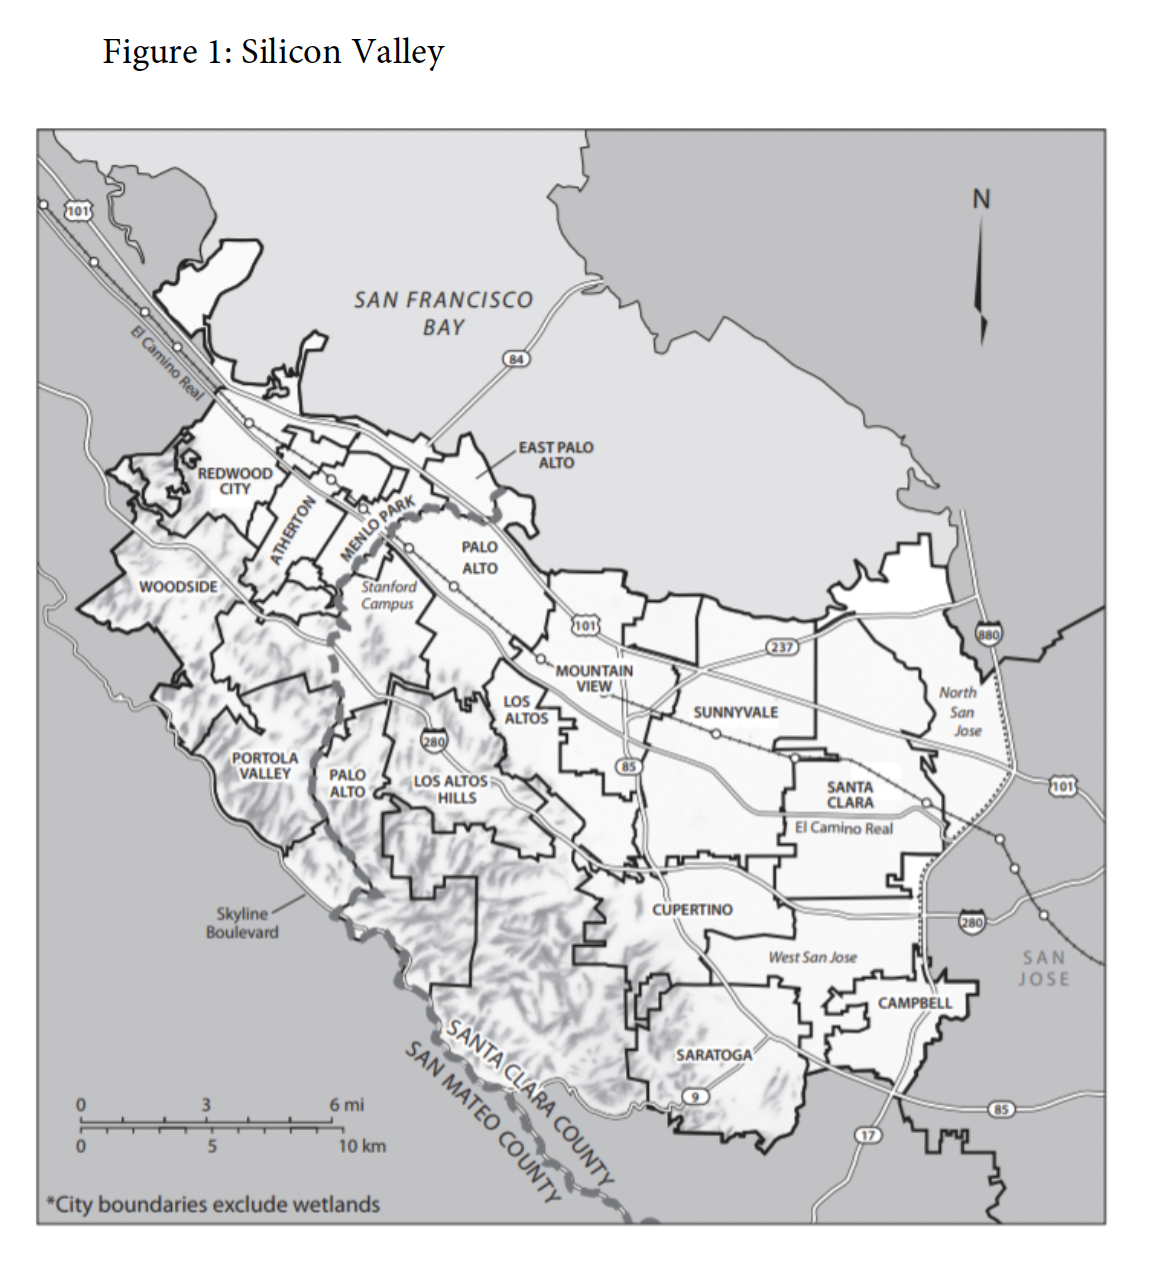
border of the region examined. The local governments in the area include fifteen municipalities, the City of San Jose (two of whose neighborhoods are included), and San Mateo and Santa Clara Counties, each of which zone various unincorporated areas.
The lands within this sloped terrain lie in four bands, largely parallel. Each of the four warrants a shorthand. The band furthest east, usually the narrowest, is the Bayshore. Much of it consists of formerly filled tidal mud flats and salt marshes. Figure 1 shows the Bayshore Expressway (U.S. 101), the highway that serves as the band’s western border. Next to the west lies the band of Plains, roughly three miles in width in the north, but, like the Bayshore, widening toward the south. This is the most densely settled portion of Silicon Valley. Through the heart of the Plains runs El Camino Real, the area’s oldest road and currently predominantly a commercial strip. Further to the west lies the Foothills. The approximate boundary that separates the Plains from the Foothills is the aptly named Foothill Expressway, two of whose northern extensions are Junipero Serra Boulevard and Alameda de las Pulgas. Figure 2, on p. 1642, shows portions of these thoroughfares. In the portion of Silicon Valley that extends north from Cupertino, the scenic Junipero Serra Freeway (I-280) roughly bisects the Foothills band. Near that stretch of I-280 runs the San Andreas Fault, whose presence understandably has affected building designs in the region. The last of the four bands is the Mountains, the generally steep section leading up to Skyline Boulevard.
To an observer concerned with future housing production in the region, the zoning histories of the Plains and the Foothills warrant the greatest attention. The Mountains, rugged and remote, hold scant promise for housing development. The relative smallness of the Bayshore band makes it less important, although, since 1990, the Bayshore in fact has been the site of many of Silicon Valley’s densest housing developments.83
During the 1950s and 1960s, the combined populations of San Mateo and Santa Clara Counties rose by over one million, proof of robust housing demand. Yet, by 1970, housing prices around Palo Alto were only twenty percent above the national average.84 The 1950s, however, provided omens that land use regulations, particularly in the Foothills, might become more stringent. As the 1960s progressed, the omens multiplied and spread to the Plains. The next Sections explore these histories.
B. Zoning in the Foothills
Because few tracts in the Foothills are flat, lands there tend to be more expensive to develop. Where demand for housing is robust, however, the presence of slopes does not obviate residential development. Across the Bay from San Francisco, the steep hills above Berkeley and Oakland are peppered with houses up to an elevation of 1,000 feet. Many of those hillside houses sit on lots less than 8,000 sq. ft. in area, a size that the zoning officials who control Silicon Valley’s Foothills virtually never permit. Silicon Valley policymakers also zone less than 1% of the Foothills for multifamily development, a figure dwarfed by the 22% in the Plains.
Beginning in the mid-1950s, housing development in Silicon Valley’s Foothills became far more difficult. Of the many pertinent local legal events, three warrant emphasis. The first was the incorporation of a new set of suburbs. Prior to the mid-1950s, most of Silicon Valley’s Foothills had lain in unincorporated areas of San Mateo and Santa Clara Counties. In the 1950s and early 1960s, Foothill residents accomplished a handful of incorporations that shifted zoning powers from these counties to newly created municipalities. Three of these new suburbs encompassed lands mostly in the Foothills: Los Altos Hills (1956), Woodside (1956), and Portola Valley (1964).85 Some of the world’s richest individuals, among them Steve Jobs, would later buy houses in these suburbs.86 These towns’ zoning practices generally came to be more exclusionary than county policies had been.87 The three towns have, in total, an area of thirty square miles, two acres of which are zoned to permit multifamily housing. In portions of Portola Valley, where San Mateo County had earlier imposed a one-acre minimum house lot prior to the town’s incorporation, the town eventually increased that minimum to three and one-half acres.88 Two incorporations further south created Cupertino (1955) and Saratoga (1956), cities with land in both the Foothills and Plains. The homeowners who pushed for these five incorporations were primarily seeking to prevent annexation by a neighboring city, whose residents might have been less inclined to prevent the construction of least-cost housing.89
The second notable occurrence was Palo Alto’s set of annexations, between 1959 and 1968, of ten square miles of Foothill and Mountain land. The city undertook these efforts to provide open space and retard housing development in the annexed area. After the first annexation, Palo Alto opened a two-square-mile park, later named Foothill Park. In combination, these annexations almost doubled Palo Alto’s land area, but made its shape bizarre. The city’s northern half is in the Plains, just east of the campus of Stanford University, most of which lies in unincorporated Santa Clara County. A narrow strip connects Palo Alto’s northern half to the Foothill and Mountain areas that it annexed to form its southern half. (See Figure 1.)
During the decade after Palo Alto’s completion of these annexations, the city’s politics were transformed.90 In the 1950s, its city manager had been Jerome Keithley, whose overtly pro-growth policies had seldom provoked opposition. During the 1960s, however, a potent coalition of Residentialists came into being, with the central aim of slowing development. To Residentialists, Keithley symbolized the pro-growth Establishment. The struggle for control of the Palo Alto City Council turned bitter and, in 1966, Keithley resigned to become Oakland’s city manager. Over the ensuing handful of years, the Residentialists became politically dominant. By 1971, Palo Alto had begun buying land in the city’s Foothills for open space and was imposing on tracts that it did not acquire the requirement of a ten-acre house lot.91 These efforts proved largely successful. In 2018, the half of Palo Alto that lies in the Foothills and Mountains contained fewer than 100 housing units, compared to the more than 20,000 in the city’s Plains.
The third notable events were Santa Clara and San Mateo Counties’ decisions to ban residential development on virtually all of Stanford University’s nine square miles of undeveloped Foothill land.92 Figure 2 depicts Stanford’s entire land holdings. Most of the Foothills portion lies west of the main campus, beyond Junipero Serra Boulevard. Aerial photographs reveal that these university lands are conspicuously emptier than neighboring Foothill land in Silicon Valley.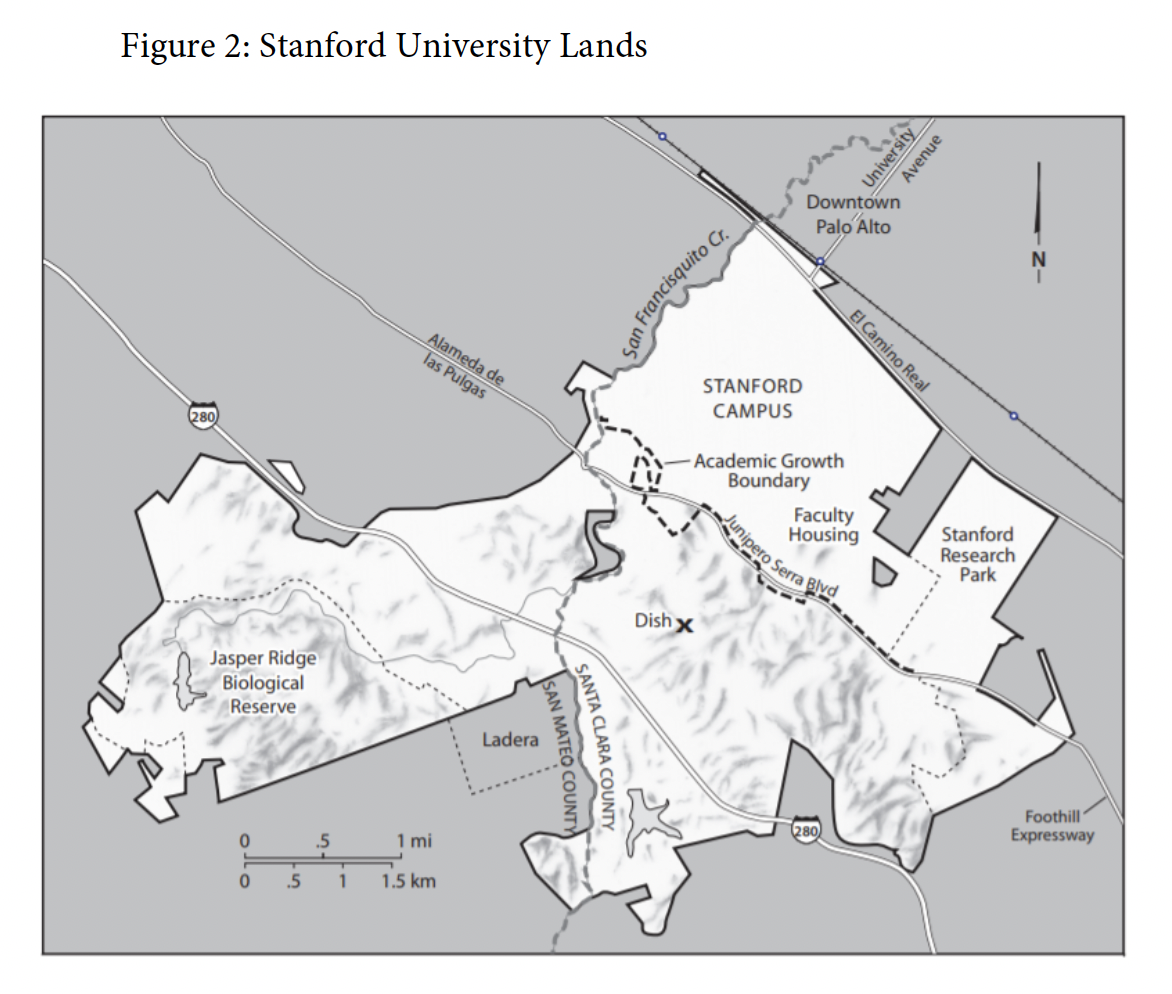
During the past century, San Mateo County’s zoning of Stanford lands in the Foothills generally has been less restrictive than Santa Clara County’s. Beginning in the late 1940s, for example, San Mateo County gave a green light to Ladera, a subdivision of 520 houses on 9,000-to-15,000 sq. ft. lots at a site wedged between, but outside, Stanford’s Foothill holdings.93 (See Figure 2.) But in 2018 there was virtually no housing on the four square miles of Stanford lands in San Mateo County. In 1973, Stanford’s Trustees voluntarily set aside the most elevated one-third as the Jasper Ridge Biological Preserve. On the remaining two-thirds, San Mateo County’s zoning essentially limits uses to single-family detached houses on lots of at least one acre, triple the size of lots in the adjacent Ladera.94 Stanford’s lands in San Mateo County in fact are mostly devoted to the Stanford linear accelerator (SLAC) and various equestrian facilities.
Santa Clara County’s zoning regulations on Stanford Foothill lands have long been tighter than San Mateo County’s. In the 1950s, Santa Clara County imposed a one-acre minimum house-lot requirement on much of its unincorporated Foothill areas, including Stanford’s.95 It thus would not have permitted a subdivision there as dense as Ladera. By the 2010s, Santa Clara County’s control on the use of Stanford’s Foothill lands were the strictest of any in Silicon Valley. The county places two-thirds of these lands in a zone that flatly forbids residential structures. For virtually all of the remainder, it requires a minimum house lot of twenty acres, the largest minimum-lot requirement of any Silicon Valley government.96 The county also has delineated an “Academic Growth Boundary” that largely tracks Junipero Serra Boulevard.97 (See Figure 2.) This boundary helps assure that Stanford’s building projects in Santa Clara County will be confined to its traditional campus area, eastward in the Plains.
Although Stanford has objected to some of the land use controls that the counties have placed on its Foothills lands, it has acquiesced in many of them.98 When dealing with Santa Clara County, Stanford’s primary goal, understandably, is to win approvals of projects proposed for sites near its traditional campus. Santa Clara County’s implicit deal with Stanford permits the university to proceed with projects east of the Academic Growth Boundary only if, to the west, it keeps its Foothills lands undeveloped. The primary lobbyists for this grand bargain have been advocacy organizations for open space, chief among them the Committee for Green Foothills.
In sum, virtually none of Stanford’s nine square miles of land lying in the accessible lower Foothills is currently devoted to housing. In light of Silicon Valley’s astronomic housing prices, the value of these holdings, if developable, might be $2 million per acre.99 If so, they would be worth around $12 billion, or about half the university’s endowment. To enable agglomeration efficiencies, an urban area requires density. The setting aside of the Stanford Foothills as viewscapes for open space is in obvious tension with the affordability of Silicon Valley housing.
C. Zoning in the Plains
The stakes of housing consumers are greatest in the Plains, the natural location of Silicon Valley’s densest residential developments. This band is relatively accessible and cheap to provide with infrastructure. In 1945, orchards covered much of the Plains, particularly its southern section. Especially during 1950–1965, Eichler and other homebuilders turned many of these formerly agricultural lands into residential neighborhoods. A dozen Silicon Valley cities zone most of this territory. (See Figure 1.) Their tastes for new housing development vary sharply.
1. Single-Family Detached Houses
Cities in the Plains are far less likely to engage in large-lot zoning than cities in the Foothills. The three suburbs entirely in the Foothills require house lots of at least one acre on 98% of their residentially zoned land. In the other twelve Silicon Valley cities, mostly in the Plains, the figure plummets to 24%.
Three Plains municipalities are the most exclusionary. In order of the descending strength of this inclination, they are Atherton, Saratoga, and Los Altos. Atherton was born to zone. In 1923, six years after California had first granted zoning power to municipalities, local residents incorporated Atherton to ward off annexation by neighboring Menlo Park.100 Atherton began its exclusionary efforts in 1928, and, since 1948, has required, throughout town, a one-acre minimum house lot.101 In January 2021, Zillow estimated the median value of an Atherton house at $6.6 million.102 Saratoga was incorporated in 1956 to forestall annexation by the City of San Jose.103 Saratoga requires a house lot of at least one-acre in 56% of its residentially zoned territory, and of 10,000 sq. ft. or more, in 98%. Los Altos, the least fancy of these three Plains suburbs, mostly requires a 10,000 sq. ft. lot in its single-family zones. These three suburbs zone a combined 1% of their lands for multifamily housing.
The other nine cities in the Plains are generally less restrictive. Indeed, until around 1965, their zoning practices seldom constrained a developer shopping for single-family land. In the 1950s, Palo Alto, the most upscale of the remaining group, required a house lot of only 6,000 sq. ft. in south Palo Alto—a requirement equal to 1.5% of the ten-acre minimum that Palo Alto currently mandates in its Foothills section. In 2015, six other Plains suburbs were choosing 6,000 sq. ft., or less, as the minimum for their most-mapped single-family zone. On this front, the suburbs in the Plains of Silicon Valley are similar to those northwest of Austin, but distinctly dissimilar from those of New Haven.104
Future housing production in the Plains will necessarily entail redevelopment. By 2015, excluding nonprofit owners, there remained in the band of Plains not a single twenty-to-forty-acre tract that was privately-owned, undeveloped, and residentially zoned. Established neighborhoods of single-family houses instead predominate. Relief for housing consumers will require the unfreezing of some of them.
2. Zoning for Multifamily Housing
The nine non-exclusionary Plains suburbs traditionally have been relatively generous in permitting apartment construction. In 2015, they together zoned 24% of their residentially zoned land for some form of multifamily housing, including townhouses and mobile home parks, at a density of at least eight dwelling units per acre. Mountain View, the suburb just south of Palo Alto and home of Google, zones 41% of its residential land in this fashion, the highest percentage of any Plains city. In addition, Redwood City, the City of Santa Clara, and Sunnyvale each allow multifamily development on over a quarter of their residentially zoned lands. Households looking for relatively inexpensive housing have disproportionately flocked to these cities, and also to North San Jose.
New multifamily projects, however, are far from easy to build in the Plains of Silicon Valley. Of the many sites zoned for multifamily use, 97.8% have already been developed in that manner. Many of the existing multifamily structures are no more than two stories high.105 Effective relief for housing consumers will require somewhat taller buildings, and, in some cases, densities greater than thirty dwelling units per acre. Few of the Plains cities, with the notable exception of Redwood City, have made significant moves in that direction.106 As a result, many of the densest recent multifamily developments in Silicon Valley have actually been built in not the Plains, but the Bayshore.107
The history of high-rise apartment buildings in Palo Alto, the heart of Silicon Valley, is particularly instructive.108 Palo Alto’s downtown centers on University Avenue. In 1929–1930, when zoning was still young, entrepreneurs erected, within two blocks of University Avenue, three 6-to-7 story apartment buildings. The next Palo Alto apartment buildings equal or greater in height went up in 1960–1965, when the city approved four more, including the 101 Alma Street condos, the city’s tallest at fourteen stories.
By the early 1970s, the anti-growth Residentialists had won political control of Palo Alto from the pro-growth Establishment.109 The Residentialists promptly imposed a maximum height-limit of fifty feet, roughly five stories, on all new buildings in Palo Alto.110 A half-century later, this fifty-foot limit, with few exceptions, remains on the books.111 In 2018, each of Palo Alto’s multifamily zones was even more restrictive, limiting heights to forty feet or less.112 Actual building heights in the city tend to be far lower. In 2018, 74% of the buildings fronting on University Avenue in the heart of downtown Palo Alto had heights of two stories or less, and only 3% exceeded four stories.113
An incident in the early 1980s illustrates the Residentialists’ aversion to dense multifamily housing in the Plains of Palo Alto. Stanford University then proposed to erect in the city a 1,100-unit mid-rise apartment development, Stanford West, for members of the university’s administrative staff. The project would have been situated within walking distance of both the Stanford Shopping Center and the center of campus. None of Palo Alto’s many existing single-family neighborhoods lay within a mile of the proposed site. Stanford nonetheless came away with nothing. In the words of the university official who managed the Stanford West proposal, “we got blown out of the water.”114 The scale of Stanford West may partly have doomed it. In recent decades, Stanford has persuaded Palo Alto to approve a handful of less massive housing developments, including a different “Stanford West” at another location.115 Stanford has had to site all these apartment projects, however, at least one block, and often far more, from any existing Palo Alto single-family neighborhood.116
D. Zoning in the Bayshore
This narrow band lies between U.S. 101 on the west and San Francisco Bay on the east. Historically, many U.S. cities, perhaps Boston most notably, expanded their footprints by filling wetlands. Prior to 1965, Bay Area governments did as well. They authorized landfills in the Bay, for example, ten miles north of Silicon Valley, to expand the site of the San Francisco Airport. South of that facility, early 1960s landfills created Foster City and Redwood Shores, two planned housing developments, the latter in Redwood City. After 1965, however, fillings of the Bay essentially stopped, and indeed reversed. In that year, the California legislature approved the creation of the San Francisco Bay Conservation and Development Commission.117 Because credible environmental concerns are likely to stem additional filling, the small size of the Bayshore limits its potential for housing development.
Seven cities control zoning in the Bayshore. The lands in this band tend to be distant from the downtowns of the cities that zone them. Although the Bayshore includes a handful of neighborhoods of single-family houses, these are far less common than in the Plains and Foothills.118 As a result, the Bayshore cities are able to zone to permit two uses that few homeowners would want in their immediate backyards. Particularly numerous are office buildings occupied by high-tech firms, each typically surrounded by parking lots for employees. Also abundant in the Bayshore, perhaps surprisingly, are mobile home parks. Developers created dozens of these, especially between 1955 and 1975. In 2018, spaces in Silicon Valley mobile home parks totaled 7,500—more than enough to house twice the population of Atherton.119 Almost three-quarters of the spaces lie in the Bayshore, with the balance mostly in close-by areas of the Plains. Sunnyvale, home to half of Silicon Valley’s mobile home spaces, has been particularly permissive.
At its southern end, the Bayshore widens to three miles, and there encompasses North San Jose, one of the many neighborhoods of that sprawling city. In 1990, most sections of North San Jose were seas of mobile home parks and low-rise office complexes. Homeowners were largely absent. These conditions enabled developers to turn a portion of North San Jose into a major escape valve for the pent-up forces of housing supply in Silicon Valley. The neighborhood became the site of many of the region’s densest multifamily developments, typically complexes of 4-to-5 story buildings.120 Since 1990, twenty or more huge apartment projects have been built in North San Jose, north of the Montague Expressway. Among the largest have been the 2,700-unit North Park (2007), the 1,750-unit Crescent Village (2013), the 769-unit Epic (2016), and the 1,308-unit River View Apartments (2016). A 2012 planning document of the City of San Jose anticipates an additional 32,000 new housing units in North San Jose alone.121
Google has recognized that a project proposed for a Bayshore site is less likely to encounter political resistance. The firm plans to erect as many as 8,000 dense housing units near its headquarters in Mountain View.122 Google’s chosen site for the project is the North Bayshore, an area east of U.S. 101 and safely distant from Mountain View homeowners.
Absent the apartment developments in North San Jose and elsewhere in the Bayshore, housing prices in Silicon Valley would be even more astronomic. In terms of urban form, however, there is a downside. Dense housing developments are better located near the urban cores of cities, not in remote industrial areas. In Silicon Valley during recent decades, only Redwood City, home of several new high-rise apartment buildings downtown, has permitted significant residential densification of its core.123
Opposition to multifamily development, as it happens, is far less intense in Silicon Valley than in the suburbs of the next metropolitan area.
III. Zoning in Greater New Haven: Land of Large Lots
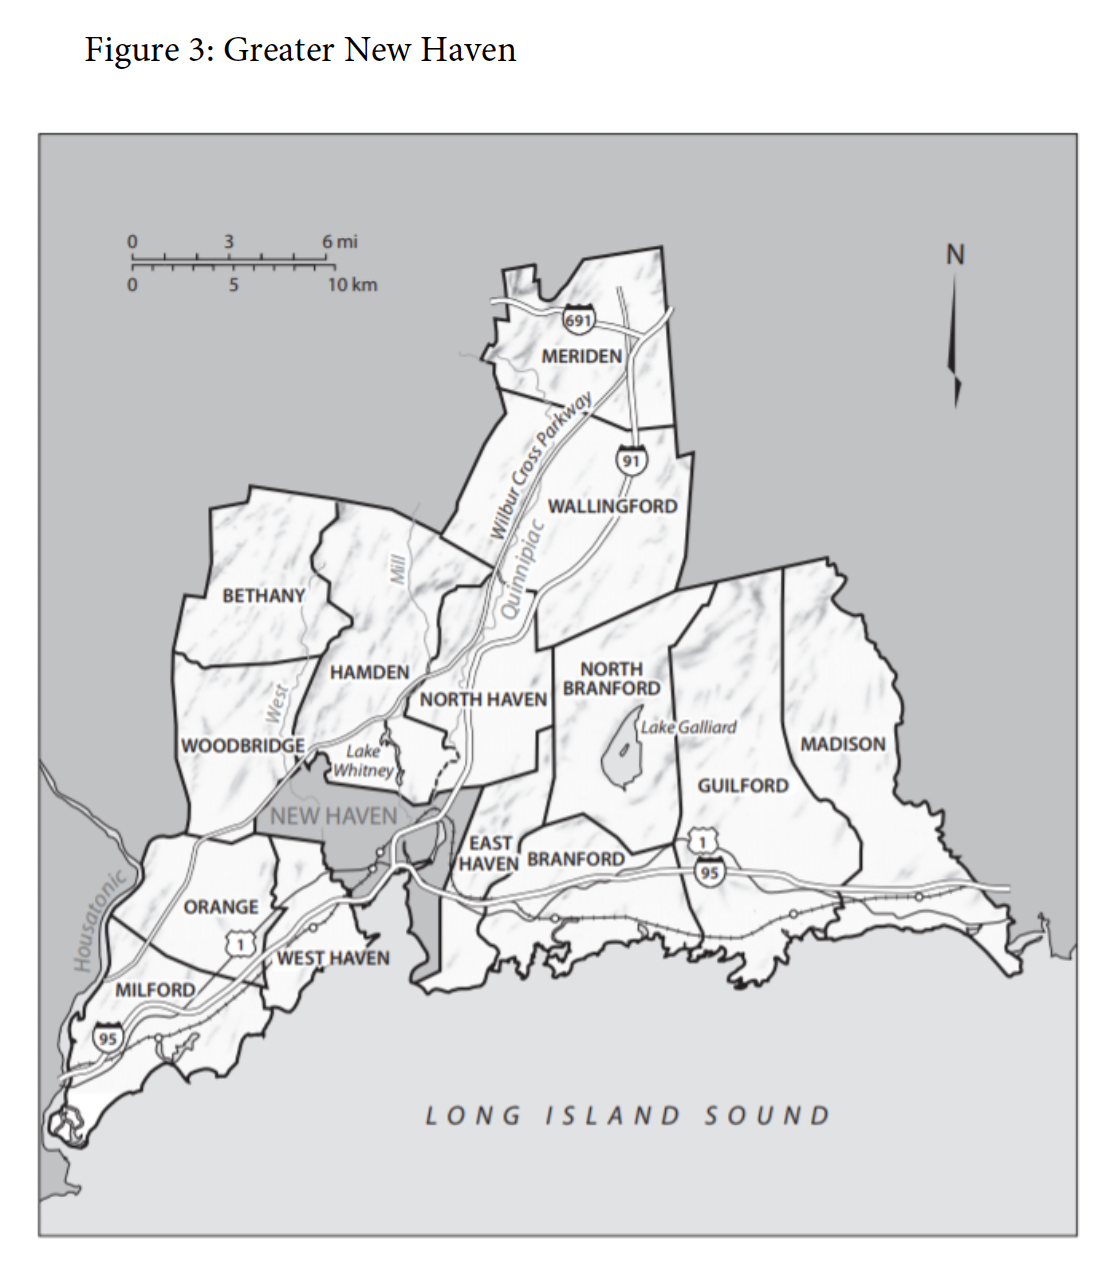
The study now turns to the zoning policies of the fourteen suburbs that surround the City of New Haven, Connecticut, our Frostbelt representative.124 As Figure 3 indicates, New Haven is a port city on Long Island Sound. It lies sixty-five miles northeast of New York City, at the far reach of a conceivable commute. I selected this metro because,
frankly, it lay conveniently at hand.125 This proximity facilitated research into suburbs’ zoning histories, information rarely available online. As it happens, the demographics of Greater New Haven are closest to those of the median U.S. metro.126 Greater New Haven also is particularly well-suited to the introduction of two topics that inevitably affect housing supply: the provision of utility services to residential areas and the setting aside of land for open space.
Measured by the metrics presented in Part I, New Haven’s suburbs have traditionally been far more exclusionary than most counterparts in Silicon Valley and northwestern Greater Austin. Zoning policies of course vary within the Frostbelt, and there is no claim here that the practices of New Haven’s suburbs are typical. Greater New Haven is not, however, unrepresentative of Connecticut. Fairfield County, which lies closer to New York City, is Connecticut’s wealthiest county and its towns are likely even more exclusionary.127 An examination in 1960 of zoning policies of localities in the seventeen counties closest to New York City, a list that did not include New Haven County, deemed practices in Fairfield County to be the most exclusionary of all seventeen.128 And the authors of several empirical studies have concluded that suburbs of Hartford, Connecticut, the state’s capital, are far more exclusionary than
New Haven’s.129 Application of the metrics offered in Part I would more conclusively confirm variations in land use policies both in Connecticut and throughout the Frostbelt.
A. Introduction to Greater New Haven
European settlers first arrived in New Haven in 1638, making it handily the first colonized of the three metros examined. Yale University was founded in 1701, almost two centuries prior to the 1880s, the decade that witnessed the opening of campuses at Stanford University and the University of Texas at Austin. New Haven’s suburbs also are relatively long-settled. In 1880, the City of New Haven’s suburbs had a combined population of 48,000. In that year, that headcount exceeded the combined population of Santa Clara and San Mateo Counties in California, and that of Travis and Williamson Counties in Texas. Even as late as 1920, the population of Greater New Haven, including the City of New Haven, exceeded the combined population of those four counties.
During the nineteenth century, both New Haven and Connecticut were at the forefront of U.S. technology, particularly in fabrication.130 Eli Whitney, a Yale graduate, is widely thought to have pioneered the use of replaceable-parts manufacturing at a site on the Mill River in Hamden, just upstream from the City of New Haven.131 By the 1850s, the City of New Haven was at the frontier of U.S. manufacturing technology, housing factories that specialized in the production of, among other products, clocks, rubber boots, and the firm that evolved into the mammoth Winchester Repeating Arms Company.132 In 1878, New Haven became the site of the world’s first telephone switchboard. Connecticut has long been one of the wealthiest states, and, up until the 1970s, was a magnet for upwardly mobile workers.133
No longer. Over the course of the twentieth century, the Greater New Haven economy shifted away from manufacturing and toward the provision of higher education and health services.134 In 2016, median household income in New Haven County was $62,700. This exceeded the U.S. figure by thirteen percent but was only about half the figure for Silicon Valley, and slightly trailed the figure for Austin’s home, Travis County, Texas.
New Haven’s suburbs almost doubled in population during the 1950s and 1960s. During that era, the City of New Haven’s nationally prominent urban renewal program helped spur suburbanization, particularly among white households.135 Between 1970 and 2016, by contrast, the annual growth of the populations of New Haven’s fourteen suburbs plummeted to less than five percent of what their annual population increment had been between 1950 and 1970. House prices reflect this falloff in demand. In the first quarter of 2019, the median price of a house in Greater New Haven was $211,000. That figure was below the national median of $255,000, and far below the median of $303,000 for Greater Austin and $1,220,000 for the San Jose metro.136
During the latter half of the twentieth century, both Silicon Valley and Greater Austin emerged as superstar metros. Demand to live in Greater New Haven, and many other parts of the Frostbelt, by contrast, is tepid. Why? Issues that I address in this Article, such as the structure of local government and the substance of zoning policy, while influential, may be less important than other factors. Climate is a prime candidate.137 Twenty-five thousand years ago, the glaciers that eventually formed the terminal moraine that became Long Island, New York, covered the New Haven region to a depth of several thousand feet. New Haven’s mean high temperature in January is 38°F, more than twenty degrees colder than the comparable figures for Palo Alto and Austin. Austin’s summers are unpleasantly hot, with an average high of 96°F in August. Since the advent of air-conditioning, however, many migrating households might rate a New Haven winter worse than an Austin summer. Another deterrent to attracting manufacturers to Connecticut is the cost of electricity, highest in the continental United States.138 During the Great Recession, GDP growth in Connecticut trailed not only the nation but also each neighboring state.139 Some commentators assert, more controversially, that Connecticut’s recent political choices have made its business climate relatively off-putting.140
More pertinent to this Article is Connecticut’s longstanding decentralized system of government. Connecticut, unlike California and Texas, has no unincorporated county areas in which new municipalities may be formed. The entire state of Connecticut instead is subdivided into 169 towns that carry out functions, such as election supervision and the keeping of land records, that many states assign to counties. In 1921, before any municipality in Greater New Haven had adopted a zoning ordinance, all fourteen of New Haven’s current suburbs not only existed, but had boundaries identical to their present boundaries. By contrast, of Silicon Valley’s fifteen current suburbs, only six had been incorporated prior to the advent of zoning in the United States, and, of northwestern Greater Austin’s eight, only two.
Connecticut’s decision a century ago to decentralize plenary zoning powers to its towns was a fateful step.141 The state’s residents have long been fervently devoted to the principle of local autonomy.142 Connecticut towns turned out to be natural vessels for the pursuit of exclusionary policies. Moreover, the zoning practices of New Haven suburbs may themselves have helped repel newcomers. These towns, like most in the state, include few neighborhoods that offer both a well-rated system of public schools and a density that enables walkability. This paucity may repel Millennials, who disproportionately prefer walkable neighbor-hoods.143
Connecticut’s local institutions are distinctive in other pertinent respects. In most towns, the members of a zoning commission are elected, not appointed, as in other states.144 This selection system may make these members even more responsive to the interests of incumbent homeowners and also increase judicial deference to zoning decisions. Also noteworthy in the land use context are two specific Connecticut statutes. The retreat of glaciers after the end of the Ice Age created an unusual number of wetlands in the state. Since 1972, Connecticut has required each town to create an Inland Wetlands Commission, a body with independent permit authority over development proposals.145 And, in 1990, Connecticut enacted the Appeals Act, an anti-snob zoning statute that directly addresses, although largely ineffectually, issues of exclusionary zoning.146
B. Zoning in New Haven’s Five Most Exclusionary Suburbs
If, in 2016, the fourteen New Haven suburbs were to have been ranked by median household income, five would have ended up on top. These five are, by my metrics, also Greater New Haven’s most exclusionary. Four—Bethany, Madison, Orange, and Woodbridge— zone more than 98% of their residentially zoned land solely for single-family dwellings on lots of at least one acre. In Guilford, the fifth, the equivalent figure is 93%. In fact, these five towns require a two-acre minimum house lot—roughly ten times the area of an Eichler 8,000 sq. ft. lot—on 55% of their residentially zoned land. Bethany, which did not adopt zoning until 1952, in 1958 decided that the only new residential use it would permit would be a single-family detached house on a lot of at least 65,000 sq. ft.147
New Haven’s five most exclusionary suburbs average twenty-eight square miles in area. That figure is six times the size of Atherton, California, and eight times that of West Lake Hills, Texas, two of their exclusionary counterparts in the other metros. None of the zoning maps of these five New Haven suburbs depicts a single-family zone where an 8,000 sq. ft. lot would be permitted as of right. Among the five, the zoning maps of only Guilford and Woodbridge include multifamily zones, which take up respectively 0.1% and 0.5% of their residentially zoned territory.
Each of these five towns contains above average portions of both wetlands/floodplains and slopes in excess of 15%.148 These conditions make development more costly but hardly prevent it. In bucolic Bethany, the town with the largest fraction of these complicating conditions, about a fifth of the wetlands and a quarter of the hillsides have already been developed into lots.149
1. The Effect of Water Supply and Wastewater Treatment on Zoning Policy
Systems for providing utility services, a topic not broached in the analysis of Silicon Valley, profoundly shape patterns of urban growth. In all three of the metros studied, utility agencies are present and influential. Of the many utility services, the methods chosen for the supply of water and the removal of wastewater typically have the greatest impact on patterns of residential development. For these services, three technological options—two widely familiar, one not—warrant mention.
To enable the exploitation of potential efficiencies of scale, most states designate a particular utility organization to provide water and wastewater removal services to a given urban area. In all three of the metros, this process commonly produces a crazy quilt of interlocking organizations, mostly public, some private. In Williamson County, Texas, suburban governments themselves typically have utility departments that provide both services. In Greater New Haven, by contrast, distinct entities usually provide them. The Southern Central Connecticut Regional Water Authority (RWA) supplies water to ten of New Haven’s fourteen suburbs. The region’s largest wastewater utility, by contrast, serves only the City of New Haven and three of its suburbs.150 In some large-lot single-family neighborhoods, such as many in Woodside, California, Orange, Connecticut, and West Lake Hills, Texas, water utilities serve most detached houses, but sewer utilities, whose pipes are more costly to install, serve few.151
A household-scale system lies at the other extreme. Many Greater New Haven suburbanites, as well as a few in the two other metros, use these for both water supply and wastewater disposal. New Haven is the wettest of the three metros, with annual rainfall of forty-eight inches, an amount normally sufficient to replenish aquifers.152 A house on a spacious suburban lot in the New Haven area commonly obtains its water from an on-site well into which an electric pump has been submersed. To dispose of wastewater, the same homeowner typically employs a septic tank, from which waste fluids eventually flow into a leaching field that distributes them into the soil of the house lot. Especially when a lot is small, the leaching process may contaminate the aquifers that provide well water to either the host house or nearby houses. Suburban officials who anticipate that homeowners will use household-scale systems commonly invoke this risk to justify imposition of a large minimum house-lot requirement.
But there is a third, much less familiar, technological option: a “decentralized,” or “community,” water and/or sanitary sewer system.153 These operate at an intermediate geographic scale—larger than a house lot, but smaller than the service area of a typical public utility. A decentralized “package plant” for treating wastewater is better able than a traditional septic tank to remove nitrates and other contaminants from effluents. An engineer designing a decentralized utility system has many options for locating both water wells and outlets for treated wastewater. When properly designed, a decentralized utility system negates the standard public-health rationale for large-lot zoning. To encourage the development of these systems, a suburb’s zoning ordinance might automatically relax a minimum-house-lot requirement when a subdivider had provided a sufficiently safe decentralized alternative. None of the zoning ordinances in either Greater New Haven or Silicon Valley, however, offers developers this option.154
Zoning officials, especially in Greater New Haven, have been eager to protect from development the natural watersheds that feed reservoirs. In a rural area, this policy commonly is cost-effective. But when applied close to the urban core, a watershed-protection policy reduces population density and is distinctly anti-urban. At a close-in location, a system of post-reservoir water purification commonly is superior.
The South Central Connecticut Regional Water Authority uses, in different places, both these means to assure water quality. In 2018, the Authority owned about 24,300 acres of land in the fourteen New Haven suburbs studied, almost eleven percent of these towns’ total acreage.155 In the relatively remote area around Lake Galliard in North Branford, the largest of the Authority’s reservoirs, the dedication of Authority lands to watershed protection likely is cost-justified. In a neighborhood close to the City of New Haven, however, a system of post-reservoir water purification makes more sense. Since 1860, Lake Whitney, a dammed reservoir on the Mill River just north in the Town of Hamden, has been the source of most of the City of New Haven’s water supply. In 2018, hundreds of Hamden dwelling units lay within one block of the shores of Lake Whitney. The tap water that the lake provides nonetheless is potable. The Authority has attained this result by repeatedly modernizing, most recently in 2005, its filtration facility just downstream from the lake.156 At this close-to-downtown location, opting for post-reservoir filtration was more utilitarian than razing hundreds of dwellings in Hamden.
A town’s decision to refuse to provide sanitary sewers can be the cornerstone of its exclusionary land use policy. Connecticut courts have repeatedly accepted the absence of sanitary sewers as an adequate justification for a town’s large-lot zoning.157 Perhaps tempted by this opportunity to secure legal cover, three of New Haven’s five most exclusionary suburbs decline to provide sanitary sewers anywhere in town. Of the remaining two, Woodbridge provides them in about seven percent of its territory, and Orange, in about fifteen percent.158 In eight of the remaining nine New Haven suburbs, by contrast, sanitary sewers serve more than half of town territory.159
A town’s decision not to sewer may be cost-justified. There may be scant demand for dense housing, and hydrological conditions may favor the use of wells and septic tanks. These conditions largely prevail in Bethany and Madison, suburbs remote from the City of New Haven. Three of the suburbs that have chosen to be mostly sewerless, however— Guilford, Orange, and Woodbridge—each include neighborhoods within a ready commute to downtown New Haven. The lack of sanitary sewers in these neighborhoods impairs the metro’s agglomeration efficiencies.
2. Open Space Set-Asides
Future historians of land policies in the United States are likely to stress two massive changes that occurred during the twentieth century. The first, portended by the arrival of zoning during the early decades of the century, was a vast increase in municipal regulation of the use of private land. The second trend has been less obvious. Partly spurred by the environmental movement that blossomed around 1970, governments and nonprofit institutions have started to protect an ever-increasing fraction of land from development of any kind. Greater New Haven has led the three metros in this pursuit, with Silicon Valley a close second, and Greater Austin not far behind.160
In the northwest sector of Austin, the most pertinent local land trust is the Hill Country Conservancy, founded in 1999. The City of Austin also has undertaken major land acquisitions in its northwestern section, primarily to add to the Balcones Canyonlands Preserve. See infra note 199 and accompanying text. To illustrate the magnitude of the change, Connecticut had no system of state parks prior to 1913.161 In 1997, the state legislature announced the goal of acquiring, or permanently protecting, twenty-one percent of the state’s land as open space by the year 2023.162
In many contexts, the preservation of open space is meritorious. Especially in a rural setting, the conservation of land can provide habitat for wildlife, preserve endangered species, protect watersheds that feed reservoirs, and offer opportunities for outdoor recreation.163 Residents of an urban area also unquestionably benefit from parks and other open spaces, welcome forms of relief from asphalt and concrete.164 During the mid-nineteenth century, civic leaders in Manhattan had the wisdom to create Central Park, which provided needed respite from the relentless northerly march of the grid of streets.165
The provision of open space in an urban area, however, is not invariably benign. The agglomeration benefits of urban living spring from population density. Open spaces reduce density. From a utilitarian perspective, just as there can be too little open space, there also can be too much. The value of a particular open space may be less than the sum of the forgone benefits of development (the opportunity costs) and the loss of agglomeration benefits. New York City’s leaders, for example, would have been foolhardy to have set aside as a park the half of Manhattan lying north of 59th Street, Central Park’s southern boundary.
Guilford, one of New Haven’s five most exclusionary suburbs and not an extreme outlier on these issues, highlights the variety of institutions that have assisted in the setting aside of open space. Guilford has a land area of forty-seven square miles, making it handily the largest of New Haven’s suburbs. Because it lies east of the City of New Haven and thus further from New York City, development pressures have been less intense. Guilford’s topography has somewhat accentuated the hankering of its residents for open space. Much of the town’s coastal area along Long Island Sound consists of tidal wetlands, and its upland regions contain several lakes. Most of the terrain in the northern half of Guilford is rugged and beyond an easy commute to downtown New Haven. Guilford’s policies regarding its southern half, bisected by I-95, more greatly affect the welfare of the residents of metropolitan New Haven.
In 1918, the fraction of Guilford’s land area set aside as open space was conceivably as low as 2%, and certainly less than 5%.166 By 2015, the percentage had risen to 33%, primarily on account of events in the northern portion of town.167 In 2018, the owners of the greatest percentages of open-space land in Guilford were the South Central Connecticut Regional Water Authority, with 11% of town acreage, and the nonprofit Guilford Land Conservation Trust, with 10%. The next highest were the town itself (7%) and the State of Connecticut (4%).
As Guilford illustrates, the flowering of open-space sentiment has prompted action by governments at all levels. Among the government inducements have been tax subsidies to nonprofit land trusts. Since 1980, the federal income tax code has included a provision governing the deductibility of the donation of a perpetual conservation easement to a land trust.168 The state of Connecticut has provided additional tax inducements.169 Since 1991, each of New Haven’s fourteen suburbs has had a land trust.170 Guilford’s land trust, created in 1965, now owns more acreage than any other in Connecticut.171
As noted, the Town of Guilford has refused to install sanitary sewers and requires a four-acre minimum house lot in much of its northern section. These policy choices have driven down the market value of undeveloped land and abetted landowners’ willingness to forgo development.
In at least five instances since 1997, New Haven’s suburbs have acquired an undeveloped tract, averaging 150 acres in area, explicitly to prevent housing development.172 Although the details of these transfers have varied, the following script generally applies.173 The town employs various exclusionary practices to depress the market value of the undeveloped tract. The landowner then threatens to sell the tract to a housing developer, perhaps one who might invoke the Connecticut Appeals Act as leverage. Bargaining between town and landowner ensues. In the end, to prevent development, the town acquires the tract, either by voluntary transfer or exercise of the power of eminent domain.
The Town of Orange, true to its traditionally exclusionary bent, carried out the most memorable of these five purchases. Hubbell, Inc. owned a 376-acre tract, in 2010 the largest undeveloped parcel remaining in Orange. The town had successively raised its minimum required house-lot for this property, starting with half an acre in 1938, the year of Orange’s first zoning ordinance, and culminating with one and a half acres in 2004. In 2010, Hubbell proposed to develop 225 houses, some of them subsidized, on the 376 acres. Hubbell eventually agreed to sell the tract to the town for $7.2 million. The town’s leaders then asked voters to ratify the purchase in a referendum. Prior to the vote, the town’s top elected official advised that the purchase would serve the fiscal interests of Orange households. He predicted that a typical homeowner’s annual costs of financing the purchase of the Hubbell site would be far less than the costs of financing services to the new residents were the property to be developed.174 In July 2011, 83% of Orange voters approved the proposed purchase.
Connecticut’s system of school finance helped clinch this outcome. Several Connecticut Supreme Court decisions, the first in 1977, compelled the Connecticut legislature to tilt formulas for state aid to schools more sharply in favor of jurisdictions with relatively poor residents, and against wealthy suburbs such as Orange.175 These changes may have deepened antigrowth sentiments in the town. It is unlikely that many Orange voters were eager to add to public open space as such. They mostly dwell in houses on lots of 0.5–1.0 acres, and the town already owned several spacious hiking areas.176 Orange voters appear to have supported the purchase of the Hubbell tract mainly to avoid fiscal burdens, and, in some instances, the prospective influx of less prosperous neighbors.
C. Zoning in New Haven’s Middle-Income Suburbs: Branford Turns Green
As Part I demonstrated, all New Haven suburbs, not just the five most exclusionary, have a penchant for both large-lot zoning and limiting as-of-right multifamily development. An important empirical question is whether these tendencies have become more pronounced over time. In general, they have. Many New Haven suburbs have significantly increased the minimum house-lot requirements in their single-family zones, and none has decreased them.177 To underscore this historical trend, this section invokes the zoning history of Branford, one of New Haven’s middle-income suburbs, and formerly an important outlet for regional development pressure.
Branford’s Green lies six miles east of the New Haven Green. In 1958, Interstate 95, as the highway is now called, first connected the two towns and spurred Branford’s development. (See Figure 3.) Between 1950 and 1980, when Branford’s policies were generally pro-development, its population almost tripled.
Daniel Cosgrove, a well-connected construction contractor and political boss, dominated Branford politics during the 1960s and 1970s.178 Cosgrove headed the local Democratic committee and, more pertinently, Branford’s sewer authority. His policies helped fuel a condo boom. By 1989, the town had granted permits for forty-seven condominium complexes with a total of 3,253 units, which in 2018 constituted about one quarter of the town’s housing stock.179 In the New Haven region, Cosgrove’s tolerance of relatively dense developments earned Branford the nickname “Condo City.”180 To avoid riling nearby homeowners, condo developers commonly placed a wreath of open space around their complexes, limiting town-wide walkability. In part because condo-living tends to be less expensive, in 2016, Branford’s median family income ranked eleventh highest among New Haven’s fourteen suburbs.
By the 1980s, Branford’s politics had begun to green. Residents formed the Branford Land Trust in 1967 and began using it as a vehicle for acquiring open space. In the early 1980s, a grass-roots group, the Beacon Hill Preservation Society, came to life and succeeded in scotching a proposal for condo development near one of Branford’s traprock ridges.181 During the 1980s, the Branford Land Trust witnessed an “explosion of energy” as its membership and land holdings both began to climb.182 Cosgrove, a skeptic of the value of preserving wetlands, had become suspiciously wealthy during the 1960s and 1970s. Cosgrove suffered a key defeat in 1983 when Judy Gott, who had run on a platform of slowing the development of high-density condominiums, was elected Branford’s First Selectwoman. In 1987, Gott pushed through a zoning amendment that reduced the maximum density of future multifamily developments from eighteen units to six units an acre, a limitation that Branford continues to retain.183
The greening of Branford’s politics has profoundly dampened housing production. During Branford’s 1960s and 1970s phase as Condo City, the town had approved 160 units of condominium development per year. During the period 1997-2016, approvals of this sort had fallen by ninety-five percent to eight per year.184 Since 1990, when the formerly approved condo projects had been built out, Branford’s population has been flat.
Branford’s political turn against development is analogous to Palo Alto’s, although a decade or two later. A valuable counterweight to my main narrative would be the history of a town where YIMBYs (Yes In My Backyard advocates) had taken over from NIMBYs.185 But the zoning histories of none of the forty-one localities included in this study fit that scenario.186
D. Zoning in New Haven’s Blue-Collar Suburbs
East Haven, Meriden, and West Haven can be called, to invoke an arguably anachronistic label, New Haven’s blue-collar suburbs. In 2013, the median household income in each, while about fifty percent higher than that of the City of New Haven itself, lagged behind the other eleven suburbs. Yet even these three suburbs engage in a form of exclusionary zoning, one not practiced by less prosperous suburbs in the other two metros.
West Haven and East Haven, as their names imply, immediately adjoin the City of New Haven along Long Island Sound. These two towns are the smallest of New Haven’s suburbs in area. West Haven came into existence in 1921 when it was carved out of the larger Town of Orange. In that year, downtown West Haven, which had enjoyed longstanding streetcar links to downtown New Haven, was already relatively dense. In 2016, 21% of West Haven’s population was African-American, the second highest percentage for a New Haven suburb.187 East Haven, by contrast, then was only 3% African-American. East Haven’s percentage of Italian-Americans is 43%, the highest in the region.188
Meriden’s downtown lies in a flat portion of Connecticut’s Central Lowlands, about halfway between the cities of New Haven and Hartford. Meriden developed as an industrial center during the late nineteenth century. By 1900, it had a population of 29,000, at that time 42% of the combined populations of New Haven’s fourteen suburbs. In 2016, 27% of Meriden’s population was Hispanic, the highest of any New Haven suburb.
The most striking aspect of these three blue-collar towns’ zoning policies is the unanimity of their refusal to allow house lots small enough to enable walkability. Each of their zoning maps permits, in a solid majority of their residentially zoned area, only single-family development. East Haven requires at least a 20,000 sq. ft. lot in these single-family neighborhoods; West Haven, 16,000 sq. ft.; and Meriden, 11,250 sq. ft. By national standards, lots of this size are remarkably spacious.189 The New Haven suburbs’ aversion to small house lots pervades New England and perhaps much of the northeastern United States.190
New Haven’s blue-collar suburbs are relatively tolerant, however, of both “missing middle” and multifamily housing complexes. East Haven allows duplexes on 39% of its residentially zoned land, more than any other suburb in the study. West Haven permits triplexes on 18%, and Meriden, either a duplex or triplex, on 8%. The three towns permit the construction of apartments or dense townhouses on 5.8% of their residentially zoned territory, a figure far higher than 0.8%, the figure for the other eleven New Haven suburbs. Meriden and West Haven also contain, between them, 56% of the undeveloped acreage that New Haven suburbs zone for multifamily use. These greenfield sites amount to 2% of their combined residentially zoned territory.
Meriden and West Haven are outliers in Greater New Haven. They would not be in northwest Greater Austin, whose suburbs collectively also zone 2% of their undeveloped land for multifamily housing.191
IV. Northwest Austin’s Booming Municipalities
Greater Austin is a plausible choice for the role of Sunbelt boomtown. Between 1970 and 2010, the populations of Travis County, where most of the City of Austin lies, and Williamson County, situated just to the north, grew by a combined 234%. This rate of population growth placed Greater Austin in the top handful of U.S. metros.192 By comparison, over the course of these same four decades the headcount in the United States increased by 52%; in Silicon Valley’s fifteen suburbs, by 39%; and in New Haven’s fourteen suburbs, by 19%. The Austin suburb of Round Rock, which in the 1990s became the headquarters of Dell Computers, is the most conspicuous of the burgeoning suburbs in Austin’s northwest sector. Figure 4 indicates its location. Round Rock’s population exploded, partly on account of annexations, from 3,000 in 1970 to an estimated 129,000 in 2018. A central contributor to Greater Austin’s growth has been Texas’s local government law, which is far better designed than both California and Connecticut law to suppress exclusionary policies.
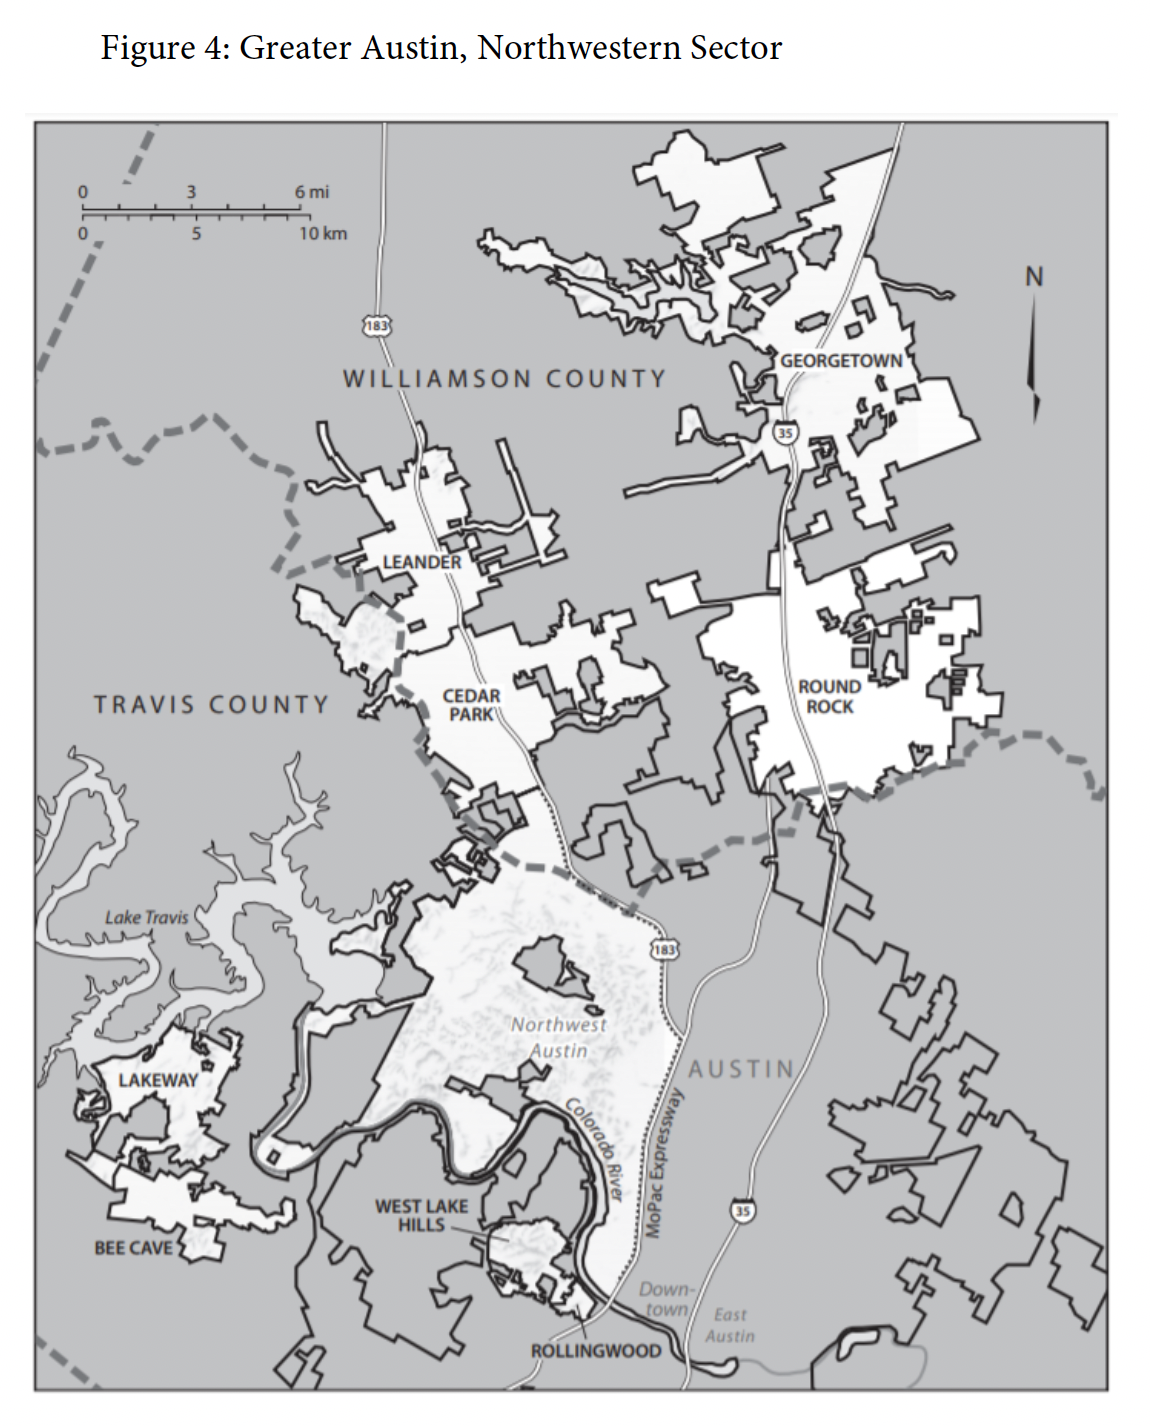 A. Introduction to the Austin Area
In 1838, the newly formed Republic of Texas chose to site its capital on a lightly settled bluff above the Colorado River, a watercourse less well-known than another with the identical name that lies a thousand miles farther west. The Austin area is the flattest of the three regions studied and, unlike Silicon Valley especially, has a plentiful supply of undeveloped land.193 West and northwest of downtown Austin, the terrain gently rises and eventually transitions into the Texas Hill Country, widely perceived as the beginning of the American West. Visible limestone outcroppings and caliche soils are common and limit farming potential, especially in the western portion of Greater Austin. Winters are mild, but summers can be oppressively hot and humid.
As elsewhere, water policies have strongly influenced development patterns. In 1937, a century after Austin’s founding, the area’s newly elected Congressman, Lyndon Baines Johnson, began a successful campaign to win federal funding for a dam on the Colorado River a dozen miles northwest of the city.194 This dam created a major reservoir, Lake Travis. Lakeway, the westernmost of the Austin suburbs included in this study, abuts its waters. Greater Austin sits above two major sources of groundwater, the Trinity Aquifer and the Edwards Aquifer.195 Water levels in both are dropping and may eventually slow the pace of the metro’s development.196
A century ago, Austin was by far the least populous of the three metros. In 1920, the population of Travis County was 58,000, about one-third that of the City of New Haven alone, and barely one-half that of Santa Clara County. The expansions of both Texas state government and the University of Texas at Austin, one of the largest universities in the United States, have contributed to Greater Austin’s surge. IT firms, searching for a metro attractive to techies but cheaper than Silicon Valley, have also contributed to regional growth. Austin loyalists tout many attractions, including the city’s reputation as the live-music capital of the world.
Like Dallas, Houston, and San Antonio, the City of Austin is physically vast. It currently encompasses three hundred square miles. That area is slightly larger than the entire Silicon Valley study area depicted in the whitish section of Figure 1, and more than fifteen times the area of the City of New Haven. To lessen computational burdens, I focused only on zoning policies in the relatively prosperous northwestern sector of Greater Austin. The light areas in Figure 4 indicate the 213 square miles included in the area of study. Many of the dark areas in Figure 4, especially those in Williamson County, are unincorporated and not zoned. More than a quarter of the light area lies within the City of Austin itself, much of it land that the city annexed between 1970 and 1989.197 The light area includes some of the City of Austin’s most upscale neighborhoods, such as Tarrytown, as well as several of its toniest suburbs, such as West Lake Hills.198 The City of Austin, working with various partners, has created the Balcones Canyonlands Preserve, an open-space project that in 2018 included about fifteen square miles of city land in the western portions of the area of study.199
Of the three metros, Austin has the fewest suburbs, an outgrowth of Texas local government law. The area of study includes eight suburbs in their entirety. Four of these, the smallest in both headcount and area, lie in Travis County south of the Colorado River. The larger four are all situated further north, in Williamson County. In 2010, average population density in the Austin study area slightly exceeded that of New Haven’s suburbs but was less than half that of Silicon Valley.200
As a laboratory, Greater Austin promised several advantages compared to other fast-growing Sunbelt metros. One is the presence of the flagship campus of the University of Texas, which enhances scholars’ familiarity with the metro. Another is the diversity of political ideologies in Greater Austin. Voters in Travis County, “a blue dot in a sea of red,” twice cast over sixty percent of their ballots for Barack Obama in presidential elections. Williamson County, by contrast, traditionally is solidly Republican. There, Barack Obama twice won only about forty percent.201 This divide promised to help shed light on whether Republican voting tendencies are associated with more restrictive, or less restrictive, zoning policies.202
B. The Pro-Growth Zoning Policies of the City of Austin and Its Suburbs
Part I provides summary data on the zoning practices in the three metros. According to all metrics applied, localities in the northwest quadrant of Greater Austin are by far the least exclusionary. For starters, they are less likely to insist on large house lots. West Lake Hills, the most overtly exclusionary of the northwest Austin suburbs, does require a minimum house lot of one acre on 99% of its residentially zoned area. However, in two respects, West Lake Hills’s form of exclusion is mild. On average, New Haven’s five most exclusionary suburbs contain eight times the acreage of West Lake Hills, which comprises only 3.7 square miles. Members of the New Haven quintet also impose a two-acre, not a one-acre, minimum on 53% of their residentially zoned land.203 And no suburb in the Austin region comes close to rivalling the large lot requirements of the Silicon Valley suburbs of Portola Valley and Woodside.
Greater Austin localities also are relatively tolerant, in single-family neighborhoods, of allowing Eichler-sized 8,000 sq. ft. lots, the bane of every New Haven suburb.204 The City of Austin and its four northernmost suburbs permit lots of this size on a whopping 55% of the area they restrict to single-family-detached development.205
The northwestern Austin sector, moreover, far outstrips the other metros in providing undeveloped sites zoned for multifamily housing. Although Silicon Valley is more than twice as dense on average and contains many more multifamily developments, its percentage of undeveloped multifamily acreage is one-tenth that of the northwest Austin.206
Texas’s fiscal structure may have helped keep its politics pro-growth. Unlike both California and Connecticut, Texas has no income tax. Property tax rates in Texas, by contrast, are high, averaging 2.18% in 2018.207 Local governments in Texas rely on property tax revenues to fund most local services, including schools. In California, by contrast, voter approval of Proposition 13 in 1976 capped property tax rates at 1%, reducing a suburb’s fiscal advantages of permitting new construction.208
C. The Influence of Texas Local Government Law
Texas statutes do not direct a suburb to allow small house lots and to zone a significant fraction of vacant land for multifamily housing. But that is what most Austin suburbs do. These outcomes reflect not only the policy preferences of suburban officials but also the traditional pro-growth tilt of both the Texas legislature and the Texas judiciary. Texas’s local government law has favored the evolution of muscular central cities, such as Austin, and sharply constrained the emergence of exclusionary suburbs. Connecticut, more than California, stands at the opposite pole.209 Five Texas policies affecting the structure of local government warrant emphasis. I present them in roughly decreasing order of importance.
1. A Central City Can Veto the Incorporation of a Nearby Suburb
Texas has granted Austin, and its other most populous cities, the right to prevent the creation of a new municipality within five miles of its borders. The five-mile distance defines the reach of a populous city’s Extraterritorial Jurisdiction (ETJ), an acronym familiar to Texas attorneys and planners.210 In the 1950s, Austin did acquiesce in the creation of the small municipalities of West Lake Hills and Rollingwood, each located a few miles west of downtown. But, over the decades, Austin typically has been hostile to the formation of new suburbs within its ETJ, perhaps on account of its aspirations to eventually annex the territories involved. The contrast with Connecticut, where suburban towns have permanently ringed central cities for a century or two, is particularly striking. A Texas approach to municipal formation also would have transformed local governance in Silicon Valley. There the backers of many successful municipal incorporations sought to ward off annexation by a nearby city, such as San Jose.211 Had California law conformed to Texas law, San Jose could have vetoed the creation of these new suburbs.
2. Counties Lack Authority to Zone
Texas, unlike California and most other states, denies a county the power to enact a zoning ordinance.212 Texas, however, is hardly anarchic. The state authorizes a county to impose subdivision regulations on its unincorporated territory, and many counties in the Austin metro have done so.213 These regulations may include minimum lot-size requirements, such as Travis County’s minimum of one acre for a lot that will rely on a septic tank.214 These mandates, however, typically are far less stringent than, for example, San Mateo and Santa Clara Counties’ restrictions on the development of Stanford’s Foothill lands.215
3. The Power, Especially of a Central City, to Annex Territory Unilaterally
Prior to 2017, Texas authorized its populous chartered cities, such as the City of Austin, to expand unilaterally.216 Until that year, a municipality had the power to annex unincorporated territory within its ETJ, even over the objection of residents and landowners in the annexed area.217 Like many of Texas’s populous cities, the City of Austin warmly embraced this invitation.218 By 2017, the northernmost extremity of the City of Austin had indeed pushed beyond Travis County into Williamson County. Annexations have multiplier effects in Texas. By annexing, a city can extend its ETJ, and thus the geographic reach of its powers to both annex and veto the creation of a new suburb.
4. Policies That Enable Developers to Obtain Utility Services
In Texas, a government that provides utility services has a duty to serve, usually at a fee, all lands that it has fully annexed.219 The four large suburbs in Williamson County each have a utility department that provides both water and sanitary sewer services to most residents. In Greater New Haven, in sharp contrast, the centerpiece of some towns’ exclusionary policies has been the denial of these services.220
A Texas municipality typically has no duty to provide utility services to lands beyond the boundaries of its service area, which commonly track city boundaries.221 Texas statutes, however, offer a developer of a tract in an unincorporated area the option of establishing a Municipal Utility District (MUD). A Texas MUD averages less than a square mile in area, making some of them suitable candidates for employment of decentralized utility technologies.222 Both the Texas Commission on Environmental Quality and the city whose ETJ includes the proposed MUD have to consent to its formation.223 Nevertheless, both routinely do. Round Rock’s ETJ, for example, currently includes thirteen MUDs.224 The legislature’s provision of the MUD alternative, long controversial in Texas, is yet another symbol of the state’s pro-growth inclinations.225
The Texas annexation process commonly produces suburbs with weirdly shaped boundaries. In Connecticut and, to a lesser degree, California, most municipalities are compact. As Figure 4 indicates, Texas cities can look like portions of a Rorschach test. Northwest Austin area suburbs, particularly those in Williamson County, are full of holes (unincorporated areas) and include grotesquely shaped arms (typically, extensions along highways or rivers). The latter may reflect municipalities’ efforts to extend their ETJs, reap fiscal benefits, and obtain the power to zone the annexed area. Landowners also may have initiated some of these annexations, especially when creating a MUD would be inferior to belonging a municipality saddled with a duty to serve.
5. Texas’s Independent School Districts Have Their Own Boundaries
In Connecticut, school district boundaries largely track town boundaries.226 When the boundaries of both are congruent, Connecticut zoning commissioners know that their decisions will significantly influence the socioeconomic status of children enrolling in local public schools.227 And they also know that the local portion of the costs of public education will invariably fall on members of their electorate. In both California and Texas, the link between zoning decisions and education is present but somewhat weaker. The high school that serves Atherton, California, the wealthiest town in Silicon Valley, for example, also serves East Palo Alto, California, the region’s least wealthy.228 The adjective “independent” appears in the name of most school districts in Texas, where district boundaries may spill over city borders.229 The Eanes School District, one of the highest rated in the Austin area, includes not only Rollingwood and West Lake Hills but also much of the territory north and west of those suburbs. The Leander ISD includes both the City of Leander and the City of Cedar Park. This uncoupling of school district lines from city boundary lines somewhat attenuates incentives for exclusionary zoning.230
D. Racial Segregation in the Three Metropolitan Areas
Because Texas formerly was a Confederate state, it is timely to introduce the topic of racial demography. A century ago, many early supporters of zoning in the United States lauded its potential for promoting racial segregation.231 Courts and legislatures of course have deemed explicit zoning by race to be illegal.232 Residential racial segregation nonetheless unquestionably continues in the United States, limiting the life chances of members of racial minority groups.233
Commentators debate the weightiness of the many causes of residential segregation by neighborhood.234 Current public policies, among them exclusionary zoning, certainly have contributed.235 So have private actions, such as steering by real estate brokers. In addition, largely discontinued past practices, such as racially restrictive covenants and overt redlining by mortgage lenders, may have cast shadows whose effects continue.236 Households’ locational preferences also are pertinent. As Thomas Schelling has shown, if the race of neighbors is salient to a dwelling-seeker and individuals generally prefer to live in a neighborhood with many residents like themselves, even a society cleansed of racist practices might end up with neighborhoods that differ by race.237
1. Trends in Racial Demography
By almost all measures, the incidence of racial segregation is declining in the United States.238 In 1968, the Kerner Commission famously declared that “[o]ur nation is moving toward two societies, one black, one white—separate and unequal.”239 This statement eloquently reminded the nation of challenges stemming from a legacy of slavery. But the Kerner Commission badly forecast the nation’s actual demographic future. In Silicon Valley in 2014, the sum of Blacks and whites in fact was significantly less than the sum of Asians and Hispanics.240 Between 2000 and 2014, the number of both Black and white residents in Silicon Valley each declined by 14%. Greater New Haven and Greater Austin, like most metros, also have witnessed large increases in those who self-identify as either Asian or Hispanic. Table 8 presents snapshots of the racial demographics of the three metros in two years, 1950 and 2014.241
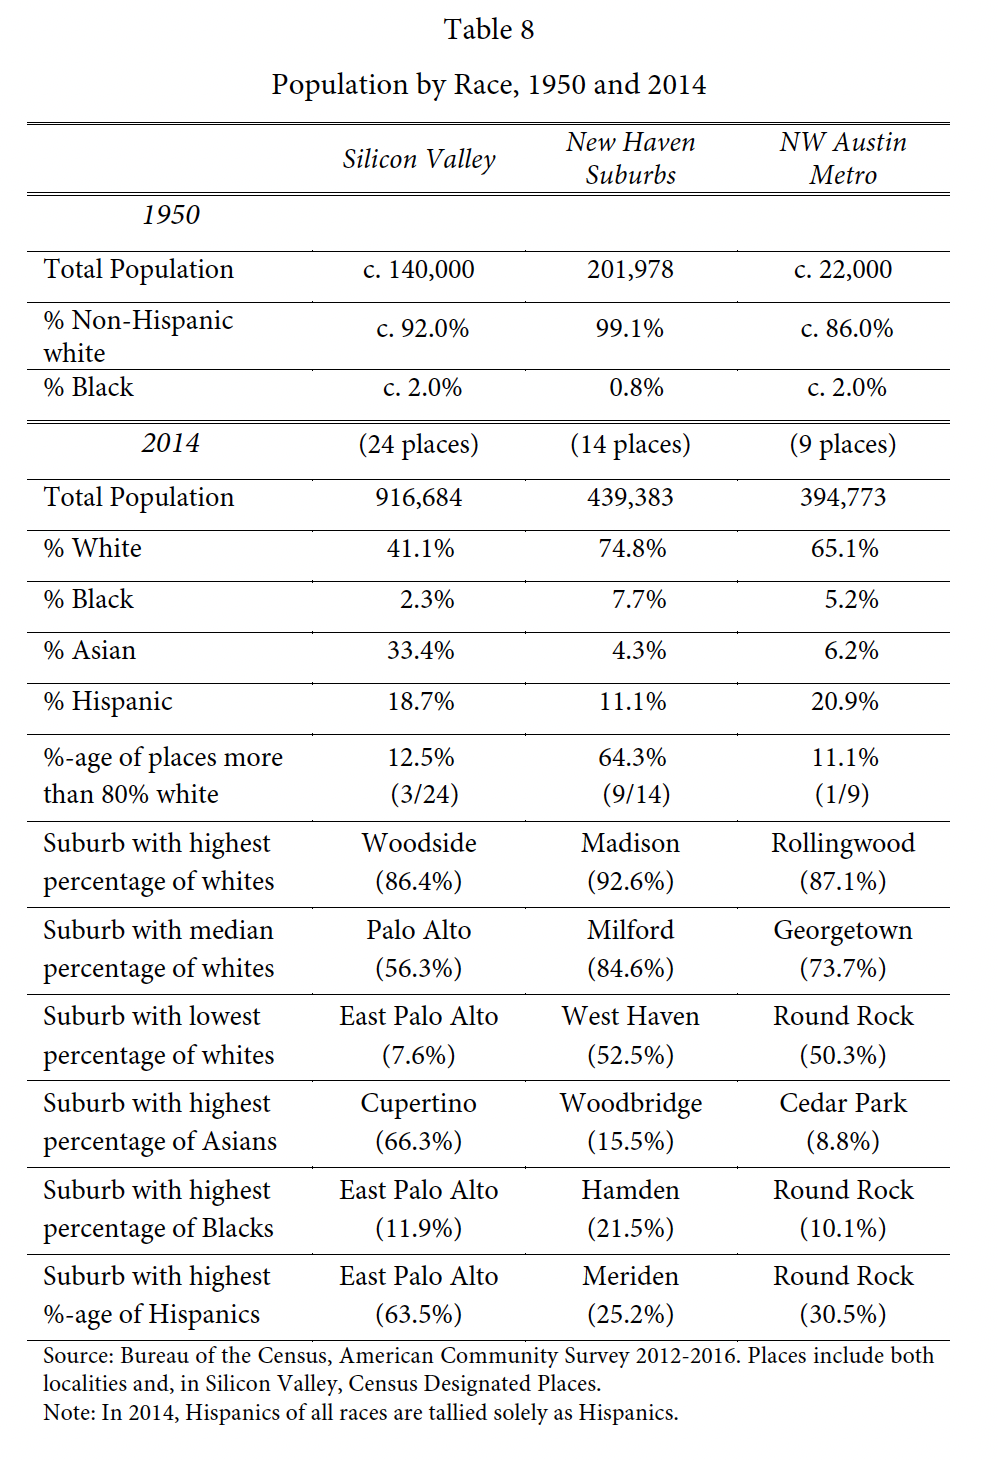
Between 2000 and 2014, the number of whites in the northwestern sector of greater Austin rose by 84,000.242 During that same period, by contrast, Silicon Valley lost 59,000 whites, and the New Haven suburbs, 27,500. As Table 8 indicates, in Silicon Valley the percentage of whites fell the furthest, from 92% in 1950 to 41% in 2014.243 In New Haven’s suburbs, whose combined populations include the highest percentage of whites in the three metros, the drop over the course of that sixty-four-year period was from 96% to 75%. In 1970, all fourteen of New Haven’s suburbs were more than 90% white. By 2014, only Guilford and Madison, both east of the city, remained that way. On the whole, the population of the northwest sector of metro Austin, which is 21% Hispanic, currently is more racially diverse than the New Haven suburbs. Greater Austin is the only region studied where Americans in all major racial groups have seen a rise in numbers.
Social scientists generally have been most troubled by the residential segregation of African-Americans. In 1950, when racial segregation was more pronounced in the United States, each of the three metros had a recognized Black neighborhood with relatively distinct boundaries. In the Silicon Valley of the 1950s and 1960s, many Black households lived east of the Bayshore Expressway in either East Palo Alto, then unincorporated, or Belle Haven, an adjoining neighborhood in Menlo Park. In the City of New Haven, Dixwell historically was the center of Black settlement, especially before the 1950s when an urban renewal program decimated the neighborhood.244 In the City of Austin in the mid-twentieth century, Black households were concentrated in East Austin. East Austin lies east of East Avenue, the street that in 1962 was widened to become I-35.245 In 1928, the City of Austin had contemplated taking affirmative steps, in almost certain violation of Supreme Court precedent, to create a “Negro District” in East Austin.246
In all three metros, the residential segregation of African-Americans has become less prevalent. In 1950, eight of New Haven’s fourteen suburbs had fifty or fewer Black residents. By 2014, none of them did. In 1970, 83% of Black households in the New Haven metro resided in the City of New Haven. By 2014, this percentage had declined to 56%. If recent trends continue, by 2030 over half of the Greater New Haven’s Black population will be living in the suburbs. The Black population in East Austin similarly has plummeted as that area has gentrified.247 By 2010, more Black households in the Greater Austin area lived outside the City of Austin than in the city itself.248 Between 2000 and 2014, the number of Black households in Williamson County’s four booming suburbs—Cedar Park, Georgetown, Leander, and Round Rock—increased by 10,000, and in the latter year constituted 4% of their combined populations. In Silicon Valley, by contrast, between 2000 and 2014 the Black population fell by 3,400, to 2.3% of the region’s population, a toll of high housing prices.249 By 2014, East Palo Alto, traditionally a center of Black population, was almost two-thirds Hispanic.
Social scientists standardly employ a dissimilarity index to compute the extent of racial segregation in a particular area.250 Diversity and Disparities, a website that John Logan helps maintain at Brown University, provides dissimilarity indexes over time for all U.S. metros.251 Logan’s data affirm that Black/white segregation continues to exist in the three metros chosen for study, but that, between 1980 and 2010, it declined in each.252 According to Logan, the New Haven metro is the most racially segregated of the three, and the only one more segregated than the median U.S. metro. His data indicate that the Black/white dissimilarity index in New Haven fell, between 1980 and 2010, from sixty-nine to sixty-two. In the Austin metro, the drop was the largest of the three, from sixty-five to forty-eight, consistent with the national pattern that fast-growing metros tend to be less racially segregated.253 Logan identifies the San Jose metro, where the index dropped from forty-eight to thirty-nine, as the least segregated of the three regions. The most racially segregated metros in the U.S., many of them in the northern Midwest, are far more racially segregated than any of the three examined here.
2. Explicit and Implicit Racial Motivations for Zoning in the Three Metros
In 1920, 20% of the residents of the City of Austin were Black, a percentage then far higher than that of the City of New Haven (3%) and the City of San Jose (0.5%).254 The Black households who took part in the Great Migration from 1920 to 1970 tended to exit states such as Texas that had been members of the Confederacy. By 1950, the percentage of Blacks in the City of Austin had fallen to 13%, and, by 2014, to 7%. In the City of New Haven, by contrast, the percentage rose from 3% in 1930, to 6% in 1950, to 26% in 1970, and to 33% in 2014.
Racial considerations, perhaps subconscious, have almost certainly influenced the formally race-neutral zoning ordinances of the suburbs in all three metros.255 Prior to 1950, racial motivations probably were most important in Austin, a region where explicit Jim Crow policies had prevailed. After 1950, by contrast, race arguably was most salient in Greater New Haven. The Great Migration brought large numbers of Black households to the City of New Haven, which came to fit most closely the exaggerated stereotype of a chocolate city surrounded by vanilla suburbs. In these three metropolitan areas, only the City of New Haven, in 1967, was the site of a late-twentieth-century riot with predominantly Black participants.256
Silicon Valley unquestionably is the metro where racial animus is least likely to have tarred zoning policy. The western United States has long been the least racially segregated region in the United States. The Black population has always been small in Silicon Valley. In the City of San Jose, for example, the percentage of Black population was 0.6% in 1950, inching up to 2.5% in 1970, and to 3.1% in 2014. One of Joseph Eichler’s distinctions as a homebuilder was his overt willingness, unusual during the 1950s, to sell houses without regard to a purchaser’s race or religion.257 In Silicon Valley, however, segregation by social class appears to be roughly as pervasive as in the other two regions.
E. How Extreme Are Texas’s Policies?
In 2006, a Brookings Institution team led by Rolf Pendall published the results of a national survey of local land use regulations. Its report chided not only exclusionary regions, such as the Northeast, but also “Wild Wild Texas,” where the authors concluded localities had been regulating too little.258 Does “Wild Wild” fairly describe my findings for Northwest Austin?
Texas unquestionably fits the stereotype of a business-friendly, small-government state.259 Some critics bewail the power of the state’s homebuilding lobby.260 Both legislators and judges have nudged Texas toward lightening the burdens of land use regulations. As noted, various Texas statutes deny counties the power to zone and authorize a developer in an unincorporated area to create a MUD to provide utility services.261 Other Texas enactments limit a municipality’s authority to, for example, declare a moratorium on development, delay action on a proposed subdivision map beyond thirty days, and require a homebuilder to sell inclusionary units at below-market prices.262 And members of the Texas judiciary, compared to California’s, probably would be somewhat more sympathetic to a developer’s constitutional challenge to the magnitude of a subdivision exaction for parks.263
Nonetheless, the Brookings team has exaggerated the permissiveness of Texas’s legal culture. The Texas judiciary is not especially hostile to local zoning. The Supreme Court of Texas, like other state supreme courts, has been disinclined to uphold a constitutional challenge to a zoning constraint.264 The leading Texas decisions on large-lot zoning have sustained the practice.265 The Texas legislature also has been unusually supportive of restrictive covenants, another legal device that tends to freeze land uses in single-family neighborhoods.266 The authors of the 2008 Wharton Index, the most-cited national survey of local zoning practices, found that twenty other states had land use controls that were laxer than Texas’s.267 Moreover, Wharton’s 2019 update on the restrictiveness of metropolitan land use regulations places Dallas-Fort Worth, Houston, and San Antonio in the nation’s middle half, not in the bottom quartile, where it situates Atlanta and Chicago.268 Contrary to the Brookings team, Herkenhoff and his co-authors single out Texas’s zoning system as one that other states should emulate.269 Compared to Texas, New England states, where the area of house lots is twice the national average, are greater legal outliers.270 More fitting than Wild Wild Texas would have been Overzoned New England.
V. The Benefits of Urban Densification
This Article now takes a more overtly normative turn. In this Part, I contend that the greater residential densification of many parts of U.S. metropolitan areas would benefit the nation. I feature portions of Professorville, the single-family neighborhood close to Palo Alto’s downtown, as candidates for denser housing development.271 The construction of more housing in Professorville, of course, would clash with other worthy goals, particularly historic preservation. As this Part demonstrates, the case for densification is potent. Uncertainties of course remain, and debate rightly will continue.
Benefit-cost analysis, a familiar workhorse, provides a basic normative yardstick.272 Most commentators on land use policy employ a version of this analytic approach, including defenders of the use of zoning to slow neighborhood change.273 Benefit-cost analysis is not a magic solvent. It is inherently difficult to execute and commonly fails to include normative considerations that many regard as pertinent.274 Nonetheless, as a system for assessing both the advantages and disadvantages of densification, it has no credible rival. From a benefit-cost perspective, the construction of more housing in portions of Professorville would be meritorious if gainers from the policy—including housing consumers, housing suppliers, and the net beneficiaries of greater agglomeration—would gain enough to compensate losers from the policy, for example, some Silicon Valley commuters and Professorville homeowners.275
Land use policy is intriguing because there are sound reasons for doubting the coordinating capacities of both market forces and government planners. Justice Sutherland’s famous opinion in Euclid rightly recognized that developers of apartment houses, if unconstrained, might site them on overly small lots.276 A zoning system that restricted land uses to single-family detached houses, by eliminating that sort of risk, therefore might enhance house values.277 That solution, however, would also tend to raise housing prices and exclude some occupants from the neighborhood, costs that a benefit-cost analyst would take into account. And public land use restrictions invariably give rise to administrative costs and restrictions on a landowner’s choices among uses.278 Commentators, not surprisingly, have been deeply divided about the general merits of public land use controls.279
The case for densification assumes that adding people to a metropolis, on the whole, benefits current residents. Large metropolitan areas unquestionably are the workhorses of national economies. Productivity per capita rises by fifteen percent worldwide when a metro doubles in headcount.280 The densest U.S metro, Greater New York City, is about twice as dense as the runner-up, Greater Los Angeles, which in turn is three times denser than Greater Atlanta.281 However, the average densities of U.S. metros are markedly lower than most abroad. European metros are roughly four times denser, and Asian metros, roughly eight times.282
An invisible hand does not assure the optimality of a metro’s total population, its average population density, and the slope of the density gradient from the metro’s center. In the absence of binding public land use regulations, households’ decisions on where to reside and developers’ decisions on where to build largely determine the extent of a metro’s expansion. These private choices have pervasive spillover effects, both positive and negative. No institution that might respond to these externalities can be expected to work even close to perfectly.283 In some contexts, private parties might be able to employ contracts, norms, and other nongovernmental mechanisms to internalize the externalities of urban growth.284 In this context, however, these tools of private ordering are virtually always ineffectual. The private decisions that influence a metro’s size and density are simply too numerous and their effects too complex. The shortcomings of the invisible hand do not, of course, imply that the public sector would necessarily handle the problem more satisfactorily. A suburb’s exclusionary zoning practices can themselves generate new negative externalities, for example, by restricting the housing opportunities of nonresidents.
William Fischel has usefully drawn a “zoning haystack” that rests, at bottom, on benefit-cost analysis.285 The haystack depicts the costs of both too little, and too much, public regulation of private owners’ land use decisions. In Fischel’s depiction, “good housekeeping” zoning would maximize the value of land within a community, and would be more cost-justified than, in his words, either “zero zoning” or “no-growth zoning.”
A half-century ago, many urban specialists emphasized the negative effects of metropolitan growth. George Tolley, a University of Chicago economist, stressed in a notable 1974 article the deleterious impact of residential densification on air quality and vehicular congestion.286 Other problems, such as crime and housing costs, also tend to increase with density.287 Correctly recognizing that no invisible hand would correct these diffuse externalities, Tolley concluded that big cities tend to be too big. Since 1974, levels of air pollution in most U.S. metros have improved markedly, thanks to environmental regulations.288 Traffic congestion, however, remains a salient concern for many urbanites. In Professorville, opponents of a residential densification could sincerely ground their opposition on fears of negative effects on commuting times and parking options.
Tolley’s emphasis on the net detrimental effects of metropolitan growth, however, is passé. Beginning in the 1980s, many economists began stressing agglomeration efficiencies, a term capacious enough to encompass the positive effects of both an increase in a metropolitan area’s total population and the density of its residential neighborhoods. Edward Glaeser, a preeminent urban economist, is one of the scholars most closely associated with the idea.289 David Schleicher warrants credit for importing agglomeration theory into the legal literature.290
Agglomeration theorists identify three principal benefits of density. All stem from the fact that closer physical proximity tends to lower transportation costs and, thereby, increase chances of human interaction. First, urban density tends to reduce the costs of transporting goods, and of consumers’ trips to service providers. Manufacturers of auto parts traditionally tended to cluster near Detroit.291 Higher density also typically enhances, for example, Uber Eats options and the number of medical specialists within easy reach. Second, higher density fosters specialization of capital assets, and, more importantly, of human capital. Major sports stadiums tend to cluster in metropolitan areas, as do teaching hospitals, high-powered law firms, and innovative technology companies. Third, density increases knowledge spillovers. Information-technology specialists seek to live in Silicon Valley not only because they anticipate learning from one another, both on and off the job, but also because the social environment would spark among them sharper competition for professional status.292 All of these potentially positive effects of density are externalities that decentralized market forces could not possibly internalize.
The desirability of densifying portions of a neighborhood such as Professorville rests on three rationales. The first, and weakest, is the weight of authority. With rare exception, specialists in urban economics and related fields—the persons most knowledgeable about urban externalities of all sorts—currently are boosters of urban density. These specialists span a broad ideological spectrum, and include, among many others, William Fischel, Edward Glaeser, Paul Krugman, David Schleicher, and Jenny Schuetz.293 Fischel and Glaeser indeed have explicitly urged greater densification of Silicon Valley.294
Second, the authors of the widely heralded economic critiques of zoning cited at the outset of this article, such as Herkenhoff et al. and Hsieh and Moretti, are all implicitly pro-density.295 These authors are economists and surely aware that zoning controls might successfully curb some negative externalities. Their uniform willingness to proclaim that the zoning system is harming the national economy implies that they regard the benefits of zoning to be minor.296
Third, and most important, a handful of urban economists, most notably David Albouy, Edward Glaeser, and various co-authors, have published analyses that explicitly attempt to take into account both positive and negative externalities of densification. Each concludes that current zoning practices, on balance, are not cost-justified.297 In addition, Ahlfeldt and Pietrostefani, in the most thorough review of the pertinent literature, assert that most investigators have concluded that increases in urban density, on balance, usually have positive welfare effects.298
In sum, most urban economists now reject George Tolley’s view that metropolitan densification inflicts net costs. Greater urban concentration is back in favor.
Conclusion
Menlo Park, the city just north of Palo Alto, is the home of Facebook. In 2017, to help house its employees, Facebook and a partner opened a 394-unit apartment complex in the city. The development, known as Anton Menlo, is two miles from Facebook’s headquarters building.299 It sits in an industrial area east of the Bayshore Expressway, far from Silicon Valley’s liveliest shops and restaurants. Local politics placed Anton Menlo where it is. In a Menlo Park neighborhood of existing single-family houses, even modest ones, homeowners are readily able to use the zoning process to veto the coming of multifamily housing. To escape this zoning straitjacket, Facebook chose one of the few sites available to it.
Zoning, as practiced in much of the nation, gravely misallocates resources. Some distortions are micro, such as the mediocre siting of Anton Menlo, and the lack of walkable neighborhoods in New Haven suburbs.300 Others are macro.301 If Silicon Valley were more populous, it would be a world tech center even more attractive to IT workers. The misuse of zoning squanders land, adds to the nation’s carbon footprint, warps interstate migrants’ choices about where to reside, and helps price poor households out of wealthier neighborhoods that would offer better life prospects for their children. Of course, zoning, and allied endeavors such as historic preservation and the conservation of open space, also engender benefits. The downsides of public land use controls, however, commonly swamp their upsides. The viewscapes along the I-280 freeway through Silicon Valley’s foothills are sublime. But the protection of these vistas, along with a concatenation of other decisions, has helped boost the price of an Eichler tract house in south Palo Alto to over $2 million.
This Article is part of a book project that will include an extended discussion of possible reforms of zoning practices.302 Here, three paragraphs must suffice. Since the birth of zoning a century ago, state legislatures have been central in the shaping of land use policy.303 These bodies should take up the gauntlet of zoning reform.304 Stirrings in California, Oregon, and elsewhere affirm that state legislators are aware of the centrality of their roles.305 Because the likelihood of local self-reform is slim, state preemption of local authority, on some issues, will be necessary.306 Federal initiatives would be risky because mistakes, if made, would be national in scope. Many Beltway lobbyists likely would urge Congress to enact massively wasteful policies, such as a National Housing Trust Fund or mandatory inclusionary zoning.307
In a Palo Alto neighborhood such as Professorville, a rezoning to permit denser residential uses might triple the market value of houses. This added wealth now is mostly forgone. The most intriguing reform proposals would use this huge unearned increment—“betterment” as the English would call it—to transform the local politics of zoning.308 There are three prime candidates to receive a share of the currently forgone betterment. The first is the zoning government itself. In Professorville, Elmendorf and Shanske would endorse giving the City of Palo Alto a major fraction. They urge passage of a state statute that would enable a local government to sell to developers, at auction, rights to build denser housing.309 Palo Alto interest groups and politicians tempted by this new source of revenue might be less likely to succumb to NIMBYism. Alternatively, Schleicher proposes that a major fraction of the forgone betterment go to the owners of Professorville houses near, but not in, the areas rezoned for higher density.310 These financial payoffs, he surmises, would foster greater neighborhood political support for densification. The third basic option is to leave some or all of the betterment with owners of houses in an area rezoned for denser use. A state statute, for example, could authorize the owners of a supermajority of the land area on a particular block-front to vote to exempt themselves from Palo Alto’s land use controls, and instead to subject themselves to the design standards of a state housing agency. If state development standards proved to be less strict than Palo Alto zoning, homeowners who opted out of local zoning would share in the gains. This last strategy assumes that there are pro-density sleeper cells in Professorville and that the state could awaken them.
The central aim of each of these reforms is to use the betterment now left on the table to transform the incentives of those involved in zoning politics. The feasibility and success of these various reforms are uncertain. An advantage of a federal system of government is, in the well-known aphorism of Justice Brandeis, that states can serve as laboratories.311
In 1922, Herbert Hoover, a Stanford graduate and then Secretary of Commerce, appointed an Advisory Committee on Zoning. The committee quickly published a Zoning Primer, and in 1924 issued the Standard State Zoning Enabling Act.312 Hoover’s efforts helped fuel the spread of zoning in the United States.313 The committee’s work was based on a potentially sound premise: the risk that unregulated real estate markets produce too many nuisance-like land uses. Since the 1920s, however, many local governments have learned to use zoning powers to inflict new negative externalities. Localities do this, for instance, when they limit the housing opportunities of non-residents and prevent their metropolitan area from enjoying the many benefits of greater density. It is time for state legislators to take notice.